---
title: Work with ES|QL results in Discover
description: Filter and sort ES|QL results in Discover, select columns, and turn on the time filter for a time field other than @timestamp.
url: https://www.elastic.co/docs/explore-analyze/discover/esql-results
products:
- Elastic Documentation
- Kibana
applies_to:
- Elastic Cloud Serverless: Generally available
- Elastic Stack: Generally available
---
# Work with ES|QL results in Discover
After a query runs, you can shape what the results table shows without rewriting the query: keep or exclude rows by value, reorder them, select the columns you see, and spot where your search terms matched. This page also explains how the time filter applies to the table and the chart, and what happens when you cancel a long query.
## Before you begin
- Make sure **Discover** is in ES|QL mode. Classic mode doesn't support this functionality. To switch, refer to [Switch to Discover's ES|QL mode](/docs/explore-analyze/discover/switch-esql-mode#switch-discover-query-mode).
- You need an ES|QL query that returns rows. If you're new to ES|QL in Discover, start with [Get started with ES|QL in Discover](https://www.elastic.co/docs/explore-analyze/discover/try-esql).
## Filter from a value in the results table
Hover over a value in the results table, then filter for it or filter it out.
- `plus_circle` **Filter for** keeps that value. For example, `WHERE `machine.os` == "osx"`.
- `minus_circle` **Filter out** excludes that value. For example, `WHERE `machine.os` != "osx"`.
The tooltips of these buttons read **Filter for this** or **Filter out this**, followed by the field name.
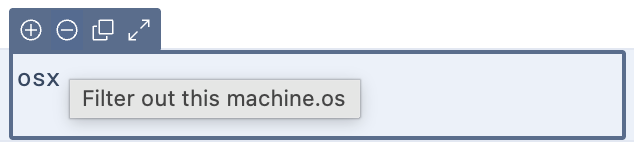
Filtering for multi-value fields translates into `WHERE MV_CONTAINS` or `WHERE NOT MV_CONTAINS` clauses. For example, `WHERE MV_CONTAINS(`tags.keyword`, ["error", "security"]::keyword)`. If Discover can't determine the field type, it uses `MATCH` clauses instead.
The query is the only place where the filter lives, so the filter shows up in the query text.
**Result:** When you select **Filter for** or **Filter out**, Discover adds or completes a `WHERE` clause for that value, and the table shows the matching rows.

## Sort query results
From the menu of a column, select a sort option. The labels depend on the column type: numeric columns offer **Sort Low-High** and **Sort High-Low**, text columns offer **Sort A-Z** and **Sort Z-A**, and date columns offer **Sort Old-New** and **Sort New-Old**. Discover reorders the rows already in the table. The query stays the same, and Discover doesn't run it again. The **Summary** column doesn't offer sorting.
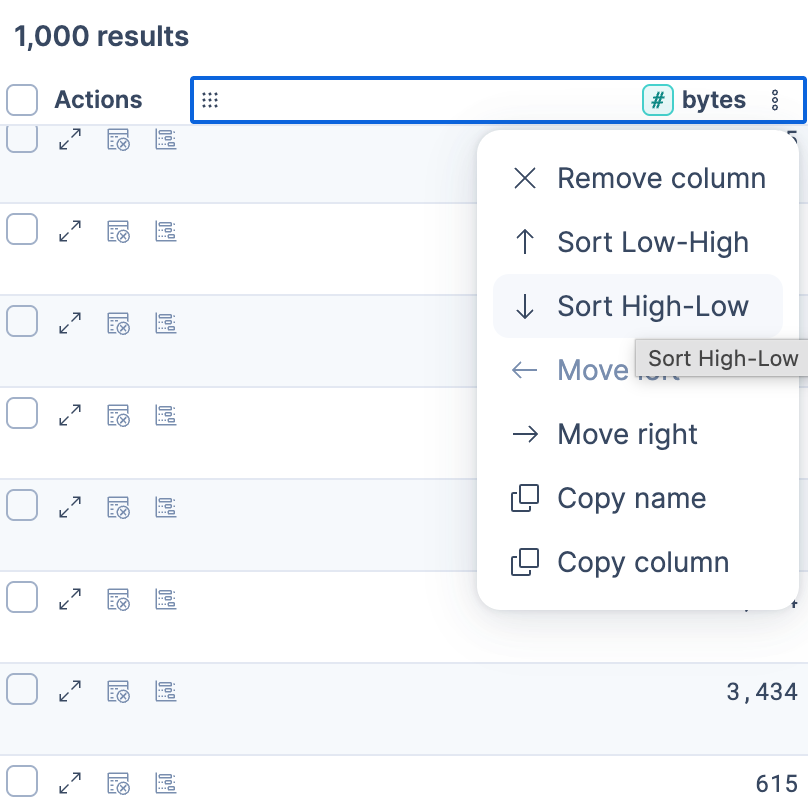
**Result:** The table shows those same rows in the new order, and the query has no `SORT` command.

A column sort reorders only the rows the query returned. For a `FROM` query with no `LIMIT`, that is at most 1,000 rows. To change which rows come back, add a [`SORT`](https://docs-edge.elastic.dev/docs/reference/query-languages/esql/commands/sort) command. Elasticsearch orders the data, then keeps the first rows of that order. This query returns the 1,000 largest `bytes` values:
```esql
FROM kibana_sample_data_logs
| KEEP @timestamp, bytes, geo.dest
| SORT bytes DESC
```
## Show specific columns in the results table
### Understand the default columns
If the query has no `KEEP`, `STATS`, or `PROMQL` command, the table shows a **Summary** column of each result's key-value pairs until you add fields. A query with one of these commands shows its result columns instead, up to the first 50 by default. The time field, which is the date field that the time filter uses, is the first column when the data has `@timestamp`, or when the query names that field.
When a query without `KEEP`, `STATS`, or `PROMQL` returns five or fewer columns, **Discover** shows each column individually instead of the **Summary** column.
Elastic Stack: Generally available Elastic Cloud Serverless: Unavailable To hide the time field, enable [**Hide 'Time' column** (`doc_table:hideTimeColumn`)](https://docs-edge.elastic.dev/docs/reference/kibana/advanced-settings#kibana-discover-settings).
Elastic Cloud Serverless: Generally available Elastic Stack: Planned To inspect each result as an expandable tree of its fields instead of columns, set **View mode** to **JSON** in **Display options**. Refer to [View documents as JSON](/docs/explore-analyze/discover/document-explorer#document-explorer-view-mode).
### Add a column from the fields list
Add a field from the [fields list in the sidebar](https://www.elastic.co/docs/explore-analyze/discover/explore-fields) to show it as its own column. The query stays the same.
Elastic Cloud Serverless: Generally available Elastic Stack: Generally available since 9.5 When the query has no `KEEP`, `STATS`, or `PROMQL` command, the time field stays the first column after you add other fields. CSV exports from **Discover** and from Discover session panels on dashboards also include the time field.
### Return specific fields with `KEEP`
To control which fields the query returns, use the [`KEEP`](https://docs-edge.elastic.dev/docs/reference/query-languages/esql/commands/keep) command:
```esql
FROM kibana_sample_data_logs
| KEEP bytes, geo.dest, machine.os, response.keyword
```
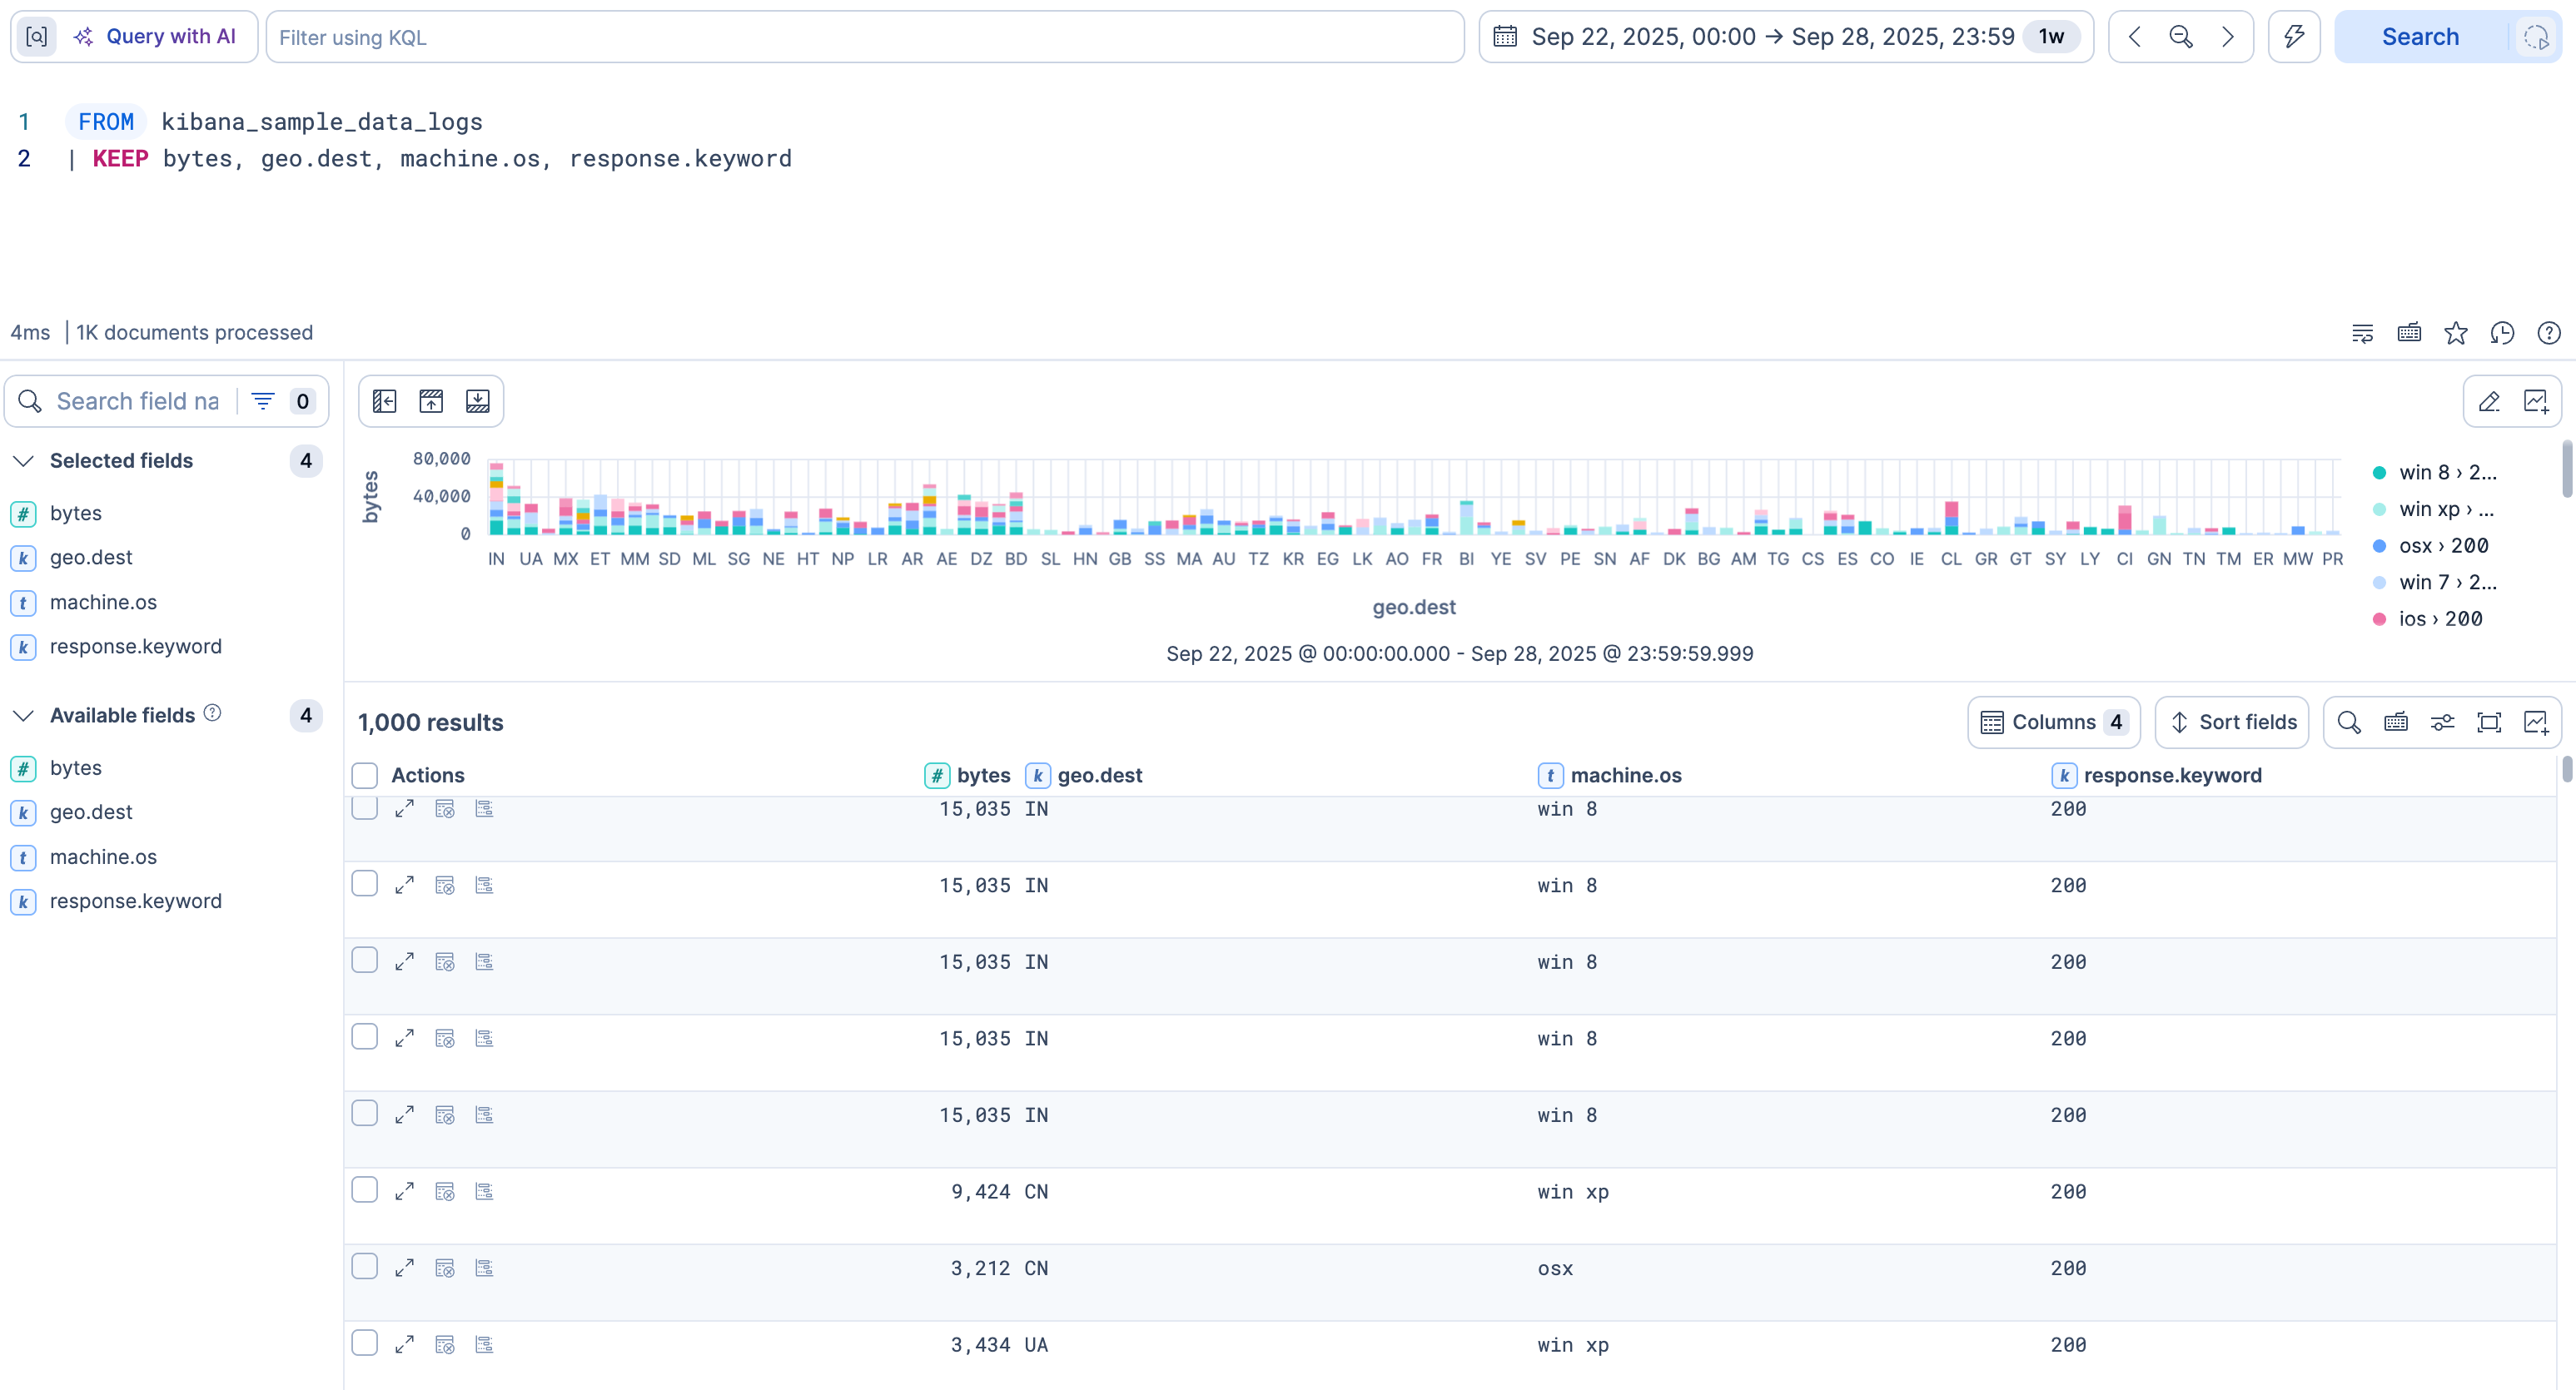
To display all fields as separate columns, use `KEEP *`:
```esql
FROM kibana_sample_data_logs
| KEEP *
```
### Add a calculated column with `EVAL`
To show a value that your data doesn't store, such as a size in kilobytes, calculate it in the query with the [`EVAL`](https://docs-edge.elastic.dev/docs/reference/query-languages/esql/commands/eval) command. The calculated value becomes a column in the table. It exists only in that query, so your data and any data view stay as they are. If you're used to adding a [runtime field](https://www.elastic.co/docs/explore-analyze/discover/add-fields-to-data-views) in classic mode, `EVAL` serves the same purpose.
```esql
FROM kibana_sample_data_logs
| EVAL kb = bytes / 1024.0
| KEEP @timestamp, bytes, kb
```
If your query uses `KEEP`, list the new column in it, or `KEEP` removes the column.
## See highlighted matches in the results table
To see which words matched a full-text search, add a command or function that highlights matches to your query. **Discover** then shows each match highlighted in the results table. You don't need to change any setting.
Elasticsearch marks a match by wrapping it in tags. For example, it returns `The Hobbit`, where `` and `` surround the matched word. Discover reads those tags and shows the word highlighted, so the tags don't appear in the table.
Discover highlights matches for:
- Elastic Cloud Serverless: Generally available Elastic Stack: Planned The [`HIGHLIGHT`](https://docs-edge.elastic.dev/docs/reference/query-languages/esql/commands/highlight) command. It writes the matches to new columns named `highlight_` plus the field name, and Discover highlights those columns. If you set your own `prefix`, `pre_tags`, or `post_tags`, the matches in the resulting columns stay highlighted.
For example, this query returns a `highlight_title` column in which Hobbit is highlighted:
```esql
ROW title = "The Hobbit"
| HIGHLIGHT "hobbit" ON title
| KEEP title, highlight_title
```
- Elastic Cloud Serverless: Preview Elastic Stack: Preview since 9.5 The [`TOP_SNIPPETS`](https://docs-edge.elastic.dev/docs/reference/query-languages/esql/functions-operators/search-functions/top-snippets) function with its `highlight` option set to `true`. Discover highlights the matches in the column that holds the snippets, including when you set your own `pre_tag` and `post_tag`.
For example, this query returns a `snippets` column in which _rabbit_ and _hole_ are highlighted:
```esql
ROW chunks = ["The white rabbit disappeared down a hole."]
| EVAL snippets = TOP_SNIPPETS(chunks, "rabbit hole", { "num_words": 0, "highlight": true })
| KEEP snippets
```
## Tell whether results are approximate
- Elastic Cloud Serverless: Preview
- Elastic Stack: Planned
On Elastic Cloud Hosted, Elastic Cloud Enterprise, Elastic Cloud on Kubernetes, and self-managed deployments, approximation requires an [Enterprise subscription](https://www.elastic.co/subscriptions). Without one, **Fast mode** is unavailable.
When Elasticsearch applies approximation to a query, for example because [**Fast mode**](/docs/explore-analyze/query-filter/languages/esql-kibana#esql-kibana-fast-mode-toggle) is on or the query explicitly sets [`approximation = true`](/docs/explore-analyze/query-filter/languages/esql-kibana#esql-kibana-approximation), a `bolt` badge shows next to the chart actions and in the table toolbar. Hover over the badge to see why the results are approximate. For what the badge and the extra columns mean, refer to [Interpret approximate results](/docs/explore-analyze/query-filter/languages/esql-kibana#esql-kibana-approximation-columns).
## Row and column limits
If you omit `LIMIT`, the table shows up to 1,000 rows. When a query uses `TS` with `STATS`, or `PROMQL`, the default is 10,000 rows. To show more rows, add a `LIMIT`. By default, Elasticsearch returns at most 10,000 rows for a query, and a higher maximum applies to queries that use `TS` with `STATS`, or `PROMQL`. Aggregations still run on the full data set. Elasticsearch cluster settings define these limits. Refer to [Result set size limit](https://docs-edge.elastic.dev/docs/reference/query-languages/esql/limitations#esql-max-rows).
- **Column limit:** For queries that use `KEEP`, `STATS`, or `PROMQL`, Discover shows the first 50 columns by default when the query returns more.
- **Empty columns:** Discover doesn't show a column that has no value in any returned row.
- **CSV export:** A CSV report of an ES|QL query stops at a row limit that depends on your deployment. Queries and aggregations still run on the full data set. To find the limit, refer to [Export results and sessions from Discover > Export Discover session results as CSV](/docs/explore-analyze/discover/export-discover-session#export-discover-session-csv).
## Set the time filter for the table and the chart
When the data has an `@timestamp` field, the time filter applies to the table and the chart.
If the time field has another name, reference it in the query with the `?_tstart` and `?_tend` parameters. These parameters hold the start and end of the time filter. For the editor behavior, refer to [Custom time parameters](/docs/explore-analyze/query-filter/languages/esql-kibana#_custom_time_parameters).
For example, the eCommerce sample data set has no `@timestamp` field. It has an `order_date` field. With this query, the time filter doesn't apply, and Discover shows no chart:
```esql
FROM kibana_sample_data_ecommerce
```
Add the parameters on `order_date`. The time filter then applies, and Discover shows the chart.
```esql
FROM kibana_sample_data_ecommerce
| WHERE order_date >= ?_tstart AND order_date <= ?_tend
| LIMIT 100
```
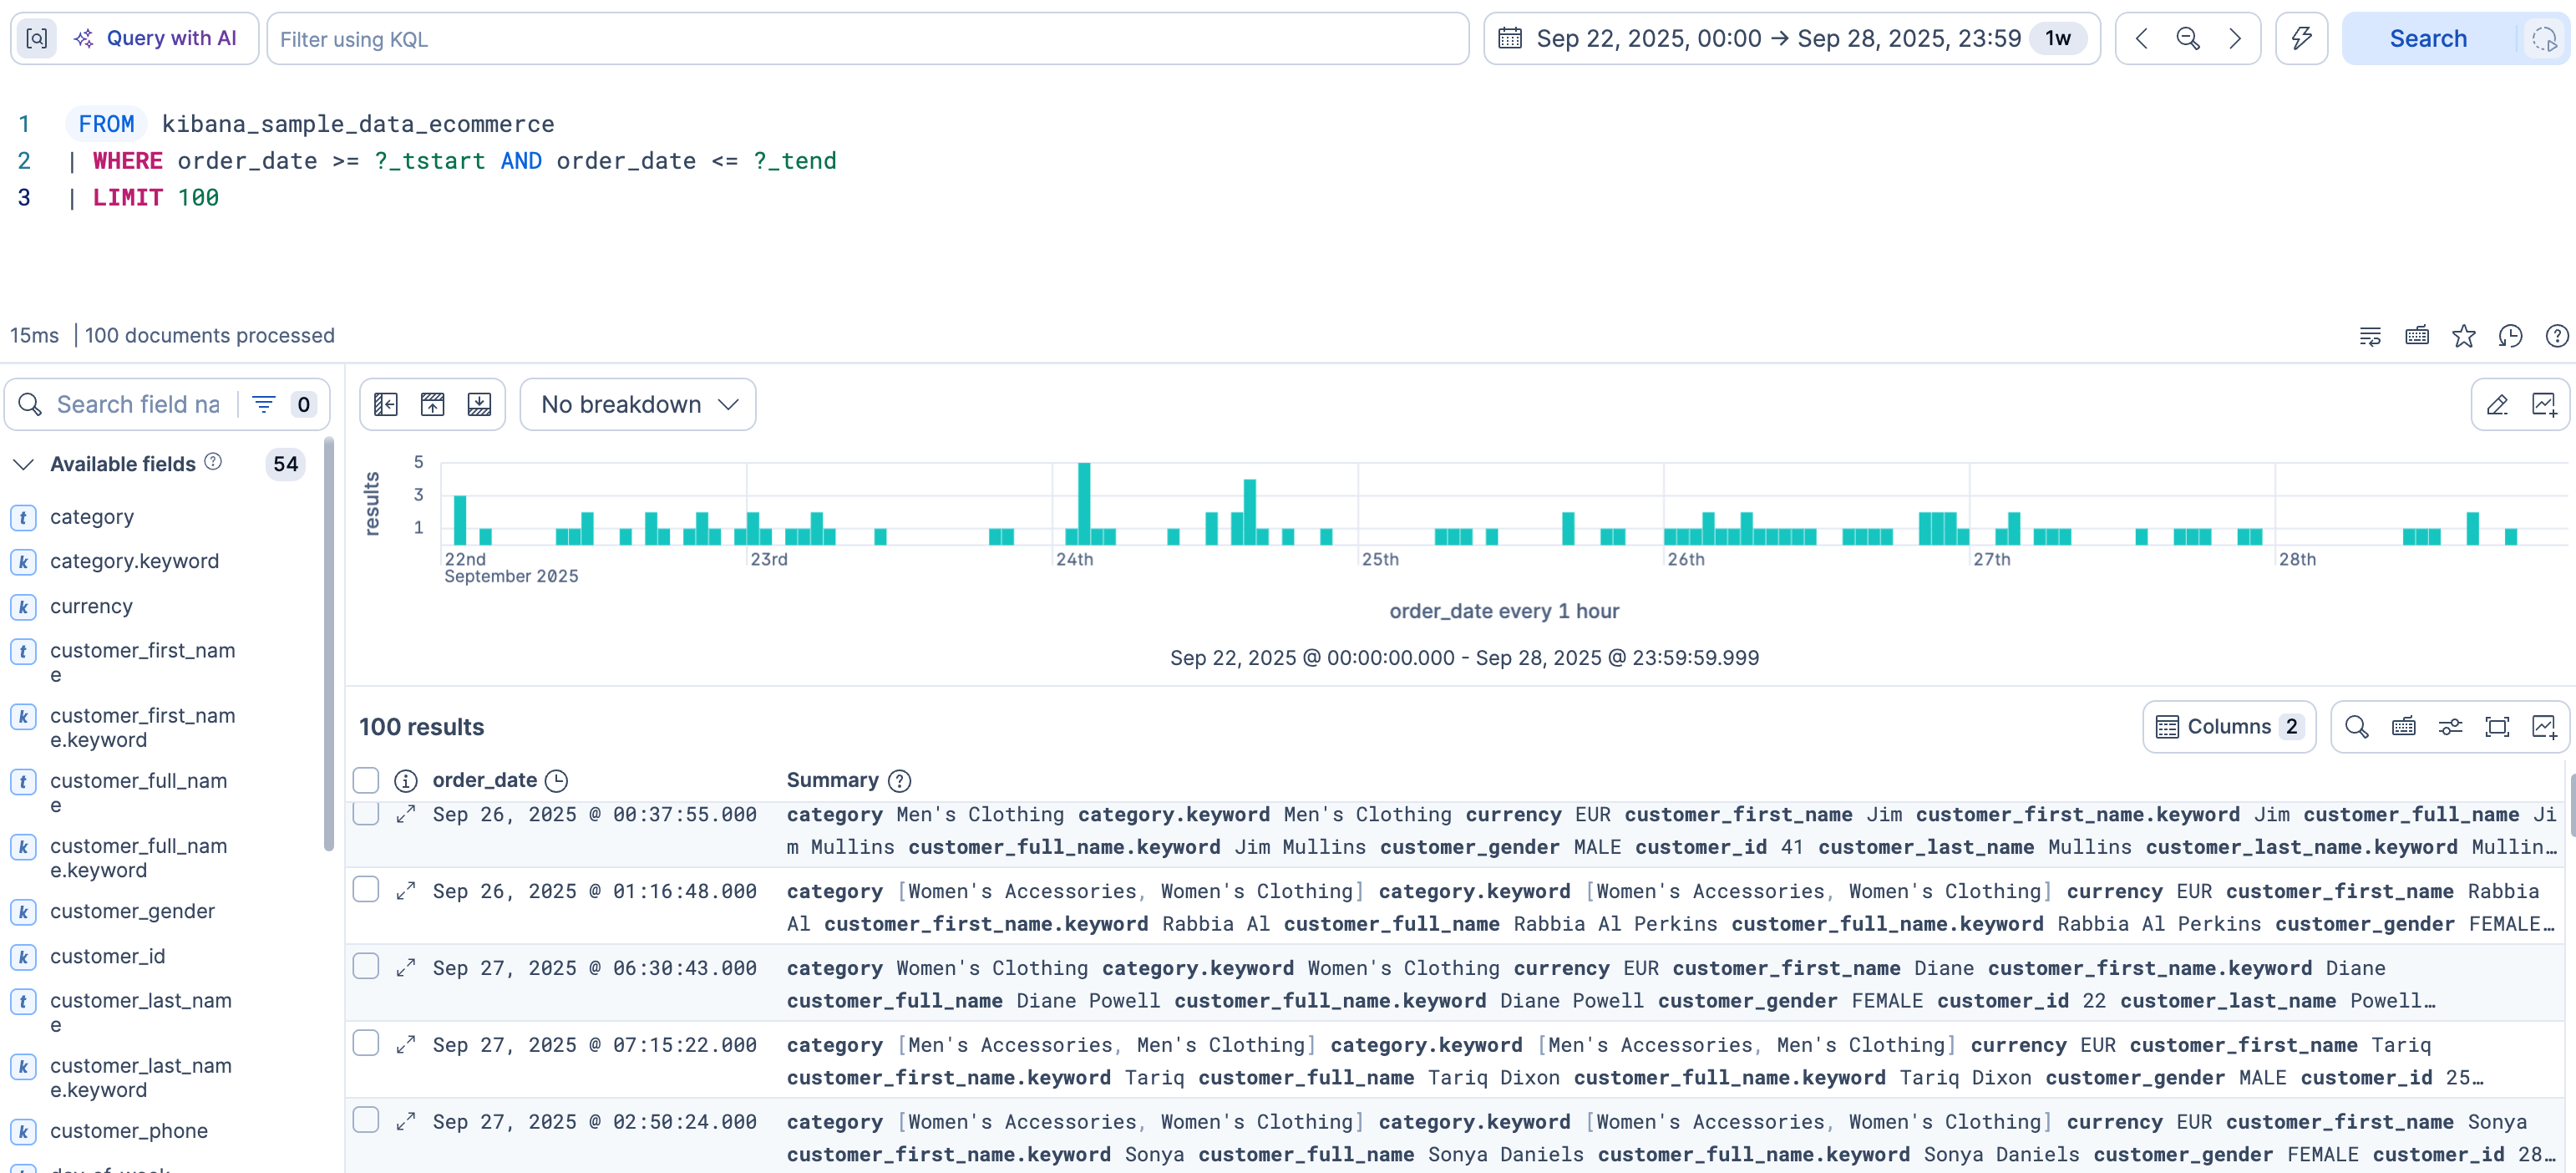
**Result:** The time filter sets the time range for that table and chart.
## Keep the chart or the table
To keep the chart or the table, use one of these options:
- **Save the Discover session.** [Save and manage Discover sessions](https://www.elastic.co/docs/explore-analyze/discover/save-open-search) explains the options.
- Elastic Cloud Serverless: Generally available Elastic Stack: Generally available since 9.4 **Save the table to a dashboard.** [Customize the table](/docs/explore-analyze/discover/document-explorer#document-explorer-customize) explains how to configure it before you [save it](/docs/explore-analyze/discover/use-sessions-in-dashboards#save-table-to-dashboard).
- **Save the chart to a dashboard.** [Change the chart type and display options](/docs/explore-analyze/visualize/esorql#_edit_and_add_from_discover) explains how to configure it before you [save it](/docs/explore-analyze/discover/use-sessions-in-dashboards#add-discover-visualization-esql).
## Cancel a query and partial results
When you cancel a running query in **Discover**, what you see afterward depends on your version.
Select the **Cancel** button that appears while the query runs. **Discover** stops the search and displays the partial results collected up to that point.
Select the **Cancel** button that appears while the query runs. **Discover** stops the search and shows an empty results table.
For long-running queries, you can also [send the query to the background](https://www.elastic.co/docs/explore-analyze/discover/background-search) instead of canceling it, allowing it to complete while you continue working.
Partial results appear when an ES|QL query times out or when you cancel it.
- The query times out. The timeout depends on your deployment and version:
- Elastic Cloud Serverless: Generally available In serverless projects, the timeout is fixed at 20 minutes.
- Elastic Stack: Planned The [`search:timeout`](https://docs-edge.elastic.dev/docs/reference/kibana/advanced-settings#kibana-search-settings) advanced setting defines the timeout. The default is 20 minutes (1200000 ms).
- Elastic Stack: Generally available from 9.1 to 9.5 The `search:timeout` advanced setting defines the timeout. The default is 10 minutes (600000 ms).
- Elastic Cloud Serverless: Generally available Elastic Stack: Generally available since 9.3 You cancel the query.
## Next steps
- To get an AI-written analysis of your results, refer to [Analyze your data with AI](https://www.elastic.co/docs/explore-analyze/discover/analyze-discover-data-with-ai).
- To look inside groups of `STATS` results, refer to [Inspect grouped STATS results in Discover](https://www.elastic.co/docs/explore-analyze/discover/inspect-grouped-stats).
- To keep your work, refer to [Save and manage Discover sessions](https://www.elastic.co/docs/explore-analyze/discover/save-open-search).
## Related pages
- [How to query in Discover's ES|QL mode](https://www.elastic.co/docs/explore-analyze/discover/use-esql)
- [Customize the Discover view](https://www.elastic.co/docs/explore-analyze/discover/document-explorer)