Armis
Serverless Observability Serverless Security Stack
| Version | 0.4.1 (View all) |
| Subscription level What's this? |
Basic |
| Developed by What's this? |
Elastic |
| Ingestion method(s) | API |
To use beta integrations, go to the Integrations page in Kibana, scroll down, and toggle on the Display beta integrations option.
Armis is an enterprise-class security platform designed to provide visibility and protection for managed, unmanaged, and IoT devices. It enables organizations to detect threats, manage vulnerabilities, and enforce security policies across their network.
Use this integration to collect and parse data from your Armis instance.
This module has been tested against the Armis API version v1.
The Armis integration collects three types of logs.
- Devices: Fetches the latest updates for all devices monitored by Armis.
- Alerts: Gathers alerts associated with all devices monitored by Armis.
- Vulnerabilities: Retrieves detected vulnerabilities and possible mitigation steps across all devices monitored by Armis.
Note:
- The vulnerability data stream retrieves information by first fetching vulnerabilities and then identifying the devices where these vulnerabilities were detected, using a chained call between the vulnerability search and vulnerability match endpoints.
Agentless integrations allow you to collect data without having to manage Elastic Agent in your cloud. They make manual agent deployment unnecessary, so you can focus on your data instead of the agent that collects it. For more information, refer to Agentless integrations and the Agentless integrations FAQ.
Agentless deployments are only supported in Elastic Serverless and Elastic Cloud environments. This functionality is in beta and is subject to change. Beta features are not subject to the support SLA of official GA features.
Elastic Agent must be installed. For more details, check the Elastic Agent installation instructions.
- Log in to your Armis portal.
- Navigate to the Settings tab.
- Select Asset Management & Security.
- Go to API Management and generate a Secret Key.
- In Kibana navigate to Management > Integrations.
- In the search bar, type Armis.
- Select the Armis integration and add it.
- Add all the required integration configuration parameters, including the URL, Secret Key to enable data collection.
- Save the integration.
In the vulnerability data stream, our filtering mechanism for the vulnerability search API relies specifically on the lastDetected field. This means that when a user takes action on a vulnerability and lastDetected updates, only then will the event for that vulnerability be retrieved. Initially, we assumed this field would always have a value and could be used as a cursor timestamp for fetching data between intervals. However, due to inconsistencies in the API response, we observed cases where lastDetected is null.
If you get the following errors in the vulnerability data stream, reduce the page size in your request.
Common errors:
502 Bad Gateway414 Request-URI Too Large
If you encounter issues in the alert data stream, particularly during the initial data fetch, reduce the initial interval.
Example error:
The server encountered an internal error and was unable to complete your request. Either the server is overloaded or there is an error in the application.
This is the alert dataset.
An example event for alert looks as following:
Example
{
    "@timestamp": "2025-03-29T00:12:57.306Z",
    "agent": {
        "ephemeral_id": "b8961f6d-527f-4e75-a54e-4440c07d7ff7",
        "id": "6e0e7fed-f6da-48e7-aa1c-3ae3eb605196",
        "name": "elastic-agent-41603",
        "type": "filebeat",
        "version": "8.18.0"
    },
    "armis": {
        "alert": {
            "activity_uuids": [
                "6f3d6d3a-6732-44cc-9d63-10a38277fb15"
            ],
            "affected_devices_count": 1,
            "alert_id": "61",
            "classification": "Security - Other",
            "description": "The Armis security platform has detected a violation of a policy and generated an alert.",
            "device_ids": [
                "854"
            ],
            "severity": "Critical",
            "status": "Unhandled",
            "status_change_time": "2025-03-29T00:12:57.306Z",
            "time": "2025-03-29T00:12:57.306Z",
            "title": "[Risk] Device Susceptible to Ransomware",
            "type": "System Policy Violation"
        }
    },
    "data_stream": {
        "dataset": "armis.alert",
        "namespace": "53950",
        "type": "logs"
    },
    "ecs": {
        "version": "8.17.0"
    },
    "elastic_agent": {
        "id": "6e0e7fed-f6da-48e7-aa1c-3ae3eb605196",
        "snapshot": false,
        "version": "8.18.0"
    },
    "event": {
        "agent_id_status": "verified",
        "dataset": "armis.alert",
        "id": "61",
        "ingested": "2025-05-23T09:34:03Z",
        "kind": "alert",
        "original": "{\"activityUUIDs\":[\"6f3d6d3a-6732-44cc-9d63-10a38277fb15\"],\"affectedDevicesCount\":1,\"alertId\":61,\"classification\":\"Security - Other\",\"connectionIds\":[],\"description\":\"The Armis security platform has detected a violation of a policy and generated an alert.\",\"destinationEndpoints\":[],\"deviceIds\":[854],\"lastAlertUpdateTime\":null,\"mitreAttackLabels\":null,\"policyId\":null,\"policyLabels\":null,\"policyTitle\":null,\"severity\":\"Critical\",\"sourceEndpoints\":[],\"status\":\"Unhandled\",\"statusChangeTime\":\"2025-03-29T00:12:57.306928+00:00\",\"time\":\"2025-03-29T00:12:57.306928+00:00\",\"title\":\"[Risk] Device Susceptible to Ransomware\",\"type\":\"System Policy Violation\"}",
        "severity": 99
    },
    "host": {
        "id": [
            "854"
        ]
    },
    "input": {
        "type": "cel"
    },
    "message": "The Armis security platform has detected a violation of a policy and generated an alert.",
    "observer": {
        "product": "Asset Management and Security",
        "vendor": "Armis"
    },
    "related": {
        "hosts": [
            "854"
        ]
    },
    "tags": [
        "preserve_original_event",
        "preserve_duplicate_custom_fields",
        "forwarded",
        "armis-alert"
    ]
}
Exported fields
| Field | Description | Type |
|---|---|---|
| @timestamp | Event timestamp. | date |
| armis.alert.activity_uuids | keyword | |
| armis.alert.affected_devices_count | long | |
| armis.alert.alert_id | keyword | |
| armis.alert.classification | keyword | |
| armis.alert.connection_ids | keyword | |
| armis.alert.description | keyword | |
| armis.alert.destination_endpoints | keyword | |
| armis.alert.device_ids | keyword | |
| armis.alert.friendly_name | keyword | |
| armis.alert.last_alert_update_time | date | |
| armis.alert.mitre_attack_labels | keyword | |
| armis.alert.policy_id | keyword | |
| armis.alert.policy_labels | keyword | |
| armis.alert.policy_title | keyword | |
| armis.alert.severity | keyword | |
| armis.alert.source_endpoints | keyword | |
| armis.alert.status | keyword | |
| armis.alert.status_change_time | date | |
| armis.alert.time | date | |
| armis.alert.title | keyword | |
| armis.alert.type | keyword | |
| data_stream.dataset | Data stream dataset. | constant_keyword |
| data_stream.namespace | Data stream namespace. | constant_keyword |
| data_stream.type | Data stream type. | constant_keyword |
| event.dataset | Event dataset. | constant_keyword |
| event.module | Event module. | constant_keyword |
| input.type | Type of filebeat input. | keyword |
| labels.is_transform_source | Distinguishes between documents that are a source for a transform and documents that are an output of a transform, to facilitate easier filtering. | constant_keyword |
| log.offset | Log offset. | long |
This is the device dataset.
An example event for device looks as following:
Example
{
    "@timestamp": "2025-03-29T10:43:55.988Z",
    "agent": {
        "ephemeral_id": "79a5a547-4482-4565-8d97-c4beaef9ec06",
        "id": "6c6c935d-c274-485e-9f33-edc5f6e46f26",
        "name": "elastic-agent-72754",
        "type": "filebeat",
        "version": "8.18.0"
    },
    "armis": {
        "device": {
            "boundaries": "Corporate",
            "business_impact": "Unassigned",
            "category": "Network Equipment",
            "data_sources": [
                {
                    "first_seen": "2024-10-09T05:09:02.988Z",
                    "last_seen": "2025-03-29T10:43:55.988Z",
                    "name": "Knowledge Base",
                    "types": [
                        "Traffic Inspection",
                        "Data Analysis"
                    ]
                }
            ],
            "display_title": "Test",
            "first_seen": "2024-10-09T05:09:02.988Z",
            "id": "1154",
            "ip_address": [
                "89.160.20.128"
            ],
            "last_seen": "2025-03-29T10:43:55.988Z",
            "mac_address": [
                "50:76:AF:D3:3F:AB"
            ],
            "manufacturer": "Test Manufacturer",
            "model": "Test Model",
            "name": "Test Name",
            "names": [
                "Test Names"
            ],
            "operating_system": "Windows",
            "operating_system_version": "Server 2016",
            "purdue_level": 4,
            "risk_level": 10,
            "sensor": {
                "name": "test Enterprise",
                "type": "test LAN Controller"
            },
            "site": {
                "location": "Zurich",
                "name": "Zurich Enterprise"
            },
            "tags": [
                "Misconfigurations"
            ],
            "type": "Switches",
            "type_enum": "SWITCH",
            "visibility": "Full"
        }
    },
    "data_stream": {
        "dataset": "armis.device",
        "namespace": "69402",
        "type": "logs"
    },
    "device": {
        "manufacturer": "Test Manufacturer",
        "model": {
            "name": "Test Model"
        }
    },
    "ecs": {
        "version": "8.17.0"
    },
    "elastic_agent": {
        "id": "6c6c935d-c274-485e-9f33-edc5f6e46f26",
        "snapshot": false,
        "version": "8.18.0"
    },
    "event": {
        "agent_id_status": "verified",
        "category": [
            "host"
        ],
        "dataset": "armis.device",
        "ingested": "2025-05-23T09:34:53Z",
        "kind": "event",
        "original": "{\"accessSwitch\":null,\"boundaries\":\"Corporate\",\"businessImpact\":\"Unassigned\",\"category\":\"Network Equipment\",\"customProperties\":{},\"dataSources\":[{\"firstSeen\":\"2024-10-09T05:09:02.988081+00:00\",\"instances\":[],\"lastSeen\":\"2025-03-29T10:43:55.988081+00:00\",\"name\":\"Knowledge Base\",\"types\":[\"Traffic Inspection\",\"Data Analysis\"]}],\"displayTitle\":\"Test\",\"firstSeen\":\"2024-10-09T05:09:02.988081+00:00\",\"id\":1154,\"ipAddress\":\"89.160.20.128\",\"ipv6\":[],\"lastSeen\":\"2025-03-29T10:43:55.988081+00:00\",\"macAddress\":\"50:76:AF:D3:3F:AB\",\"manufacturer\":\"Test Manufacturer\",\"model\":\"Test Model\",\"name\":\"Test Name\",\"names\":\"Test Names\",\"operatingSystem\":\"Windows\",\"operatingSystemVersion\":\"Server 2016\",\"protections\":[],\"purdueLevel\":4,\"riskLevel\":10,\"sensor\":{\"name\":\"test Enterprise\",\"type\":\"test LAN Controller\"},\"site\":{\"location\":\"Zurich\",\"name\":\"Zurich Enterprise\"},\"tags\":[\"Misconfigurations\"],\"type\":\"Switches\",\"typeEnum\":\"SWITCH\",\"userIds\":[],\"visibility\":\"Full\"}",
        "start": "2024-10-09T05:09:02.988Z",
        "type": [
            "info"
        ]
    },
    "host": {
        "id": "1154",
        "ip": [
            "89.160.20.128"
        ],
        "mac": [
            "50-76-AF-D3-3F-AB"
        ],
        "name": [
            "test names"
        ],
        "os": {
            "family": "windows",
            "type": "windows",
            "version": "Server 2016"
        },
        "risk": {
            "static_score": 10
        },
        "type": "Network Equipment"
    },
    "input": {
        "type": "cel"
    },
    "observer": {
        "product": "Asset Management and Security",
        "vendor": "Armis"
    },
    "related": {
        "hosts": [
            "test names"
        ],
        "ip": [
            "89.160.20.128"
        ]
    },
    "tags": [
        "preserve_original_event",
        "preserve_duplicate_custom_fields",
        "forwarded",
        "armis-device"
    ]
}
Exported fields
| Field | Description | Type |
|---|---|---|
| @timestamp | Event timestamp. | date |
| armis.device.access_switch | keyword | |
| armis.device.boundaries | keyword | |
| armis.device.business_impact | keyword | |
| armis.device.category | keyword | |
| armis.device.custom_properties | flattened | |
| armis.device.data_sources.first_seen | date | |
| armis.device.data_sources.instances.first_seen | date | |
| armis.device.data_sources.instances.last_seen | date | |
| armis.device.data_sources.instances.name | keyword | |
| armis.device.data_sources.last_seen | date | |
| armis.device.data_sources.name | keyword | |
| armis.device.data_sources.types | keyword | |
| armis.device.display_title | keyword | |
| armis.device.first_seen | date | |
| armis.device.id | keyword | |
| armis.device.ip_address | ip | |
| armis.device.ip_v6 | ip | |
| armis.device.last_seen | date | |
| armis.device.mac_address | keyword | |
| armis.device.manufacturer | keyword | |
| armis.device.model | keyword | |
| armis.device.name | keyword | |
| armis.device.names | keyword | |
| armis.device.operating_system | keyword | |
| armis.device.operating_system_version | keyword | |
| armis.device.protections.creation_time | date | |
| armis.device.protections.device_id | keyword | |
| armis.device.protections.last_seen_time | date | |
| armis.device.protections.protection_name | keyword | |
| armis.device.purdue_level | double | |
| armis.device.risk_level | long | |
| armis.device.sensor.name | keyword | |
| armis.device.sensor.type | keyword | |
| armis.device.site.location | keyword | |
| armis.device.site.name | keyword | |
| armis.device.tags | keyword | |
| armis.device.type | keyword | |
| armis.device.type_enum | keyword | |
| armis.device.user_ids | keyword | |
| armis.device.visibility | keyword | |
| data_stream.dataset | Data stream dataset. | constant_keyword |
| data_stream.namespace | Data stream namespace. | constant_keyword |
| data_stream.type | Data stream type. | constant_keyword |
| event.dataset | Event dataset. | constant_keyword |
| event.module | Event module. | constant_keyword |
| input.type | Type of filebeat input. | keyword |
| labels.is_transform_source | Distinguishes between documents that are a source for a transform and documents that are an output of a transform, to facilitate easier filtering. | constant_keyword |
| log.offset | Log offset. | long |
This is the vulnerability dataset.
An example event for vulnerability looks as following:
Example
{
    "@timestamp": "2025-04-03T10:38:59.297Z",
    "agent": {
        "ephemeral_id": "9a91aa96-816b-428a-8fc8-b3fef827ea46",
        "id": "d9276d97-c6ed-47e9-b06a-987409dc7ee8",
        "name": "elastic-agent-32198",
        "type": "filebeat",
        "version": "8.18.0"
    },
    "armis": {
        "vulnerability": {
            "affected_devices_count": 13,
            "attack_complexity": "Low",
            "attack_vector": "Network",
            "availability_impact": "High",
            "confidentiality_impact": "High",
            "cve_uid": "CVE-2024-44148",
            "cvss_score": 10,
            "description": "This issue was addressed with improved validation of file attributes.",
            "epss_percentile": 0.31,
            "epss_score": 0.00139,
            "exploitability_score": 3.9,
            "first_detected": "2025-04-03T09:18:31.915Z",
            "has_remediation_info": "No",
            "id": "CVE-2024-44148",
            "impact_score": 6,
            "integrity_impact": "High",
            "last_detected": "2025-04-03T10:38:59.372Z",
            "num_of_exploits": 0,
            "number_of_threat_actors": 0,
            "privileges_required": "None",
            "published_date": "2024-09-17T00:15:50.617Z",
            "scope": "Changed",
            "score": 10,
            "severity": "Critical",
            "status": "Open",
            "type": "OS",
            "user_interaction": "None",
            "vulnerability_match": {
                "confidence_level": "High",
                "cve_uid": "CVE-2024-44148",
                "device_id": "109",
                "first_detected": "2025-04-03T10:38:59.297Z",
                "has_remediation_info": "No",
                "last_detected": "2025-04-03T10:38:59.297Z",
                "match_criteria_string": "OS",
                "status": "Open",
                "status_source": "Discovered by Armis"
            }
        }
    },
    "data_stream": {
        "dataset": "armis.vulnerability",
        "namespace": "56787",
        "type": "logs"
    },
    "device": {
        "id": "109"
    },
    "ecs": {
        "version": "8.17.0"
    },
    "elastic_agent": {
        "id": "d9276d97-c6ed-47e9-b06a-987409dc7ee8",
        "snapshot": false,
        "version": "8.18.0"
    },
    "event": {
        "agent_id_status": "verified",
        "category": [
            "vulnerability"
        ],
        "dataset": "armis.vulnerability",
        "ingested": "2025-05-23T09:35:42Z",
        "kind": "event",
        "original": "{\"affectedDevicesCount\":13,\"attackComplexity\":\"Low\",\"attackVector\":\"Network\",\"availabilityImpact\":\"High\",\"avmRating\":null,\"avmRatingManualChangeReason\":null,\"avmRatingManualChangedBy\":\"\",\"avmRatingManualUpdateTime\":null,\"botnets\":null,\"cisaDueDate\":null,\"commonName\":null,\"confidentialityImpact\":\"High\",\"cveUid\":\"CVE-2024-44148\",\"cvssScore\":10,\"cvssScoreV4\":null,\"description\":\"This issue was addressed with improved validation of file attributes.\",\"epssPercentile\":0.31,\"epssScore\":0.00139,\"exploitabilityScore\":3.9,\"firstDetected\":\"2025-04-03T09:18:31.915543+00:00\",\"firstReferencePublishDate\":null,\"firstWeaponizedReferencePublishDate\":null,\"hasRansomware\":null,\"hasRemediationInfo\":\"No\",\"id\":\"CVE-2024-44148\",\"impactScore\":6,\"integrityImpact\":\"High\",\"isWeaponized\":null,\"lastDetected\":\"2025-04-03T10:38:59.372389+00:00\",\"latestExploitUpdate\":null,\"numOfExploits\":0,\"numberOfThreatActors\":0,\"privilegesRequired\":\"None\",\"publishedDate\":\"2024-09-17T00:15:50.617000+00:00\",\"reportedByGoogleZeroDays\":null,\"scope\":\"Changed\",\"score\":10,\"severity\":\"Critical\",\"status\":\"Open\",\"threatActors\":null,\"threatTags\":null,\"type\":\"OS\",\"userInteraction\":\"None\",\"vulnerability_match\":{\"advisoryId\":null,\"avmRating\":null,\"confidenceLevel\":\"High\",\"confidenceLevelDescription\":null,\"cveUid\":\"CVE-2024-44148\",\"deviceId\":109,\"firstDetected\":\"2025-04-03T10:38:59.297015+00:00\",\"hasRemediationInfo\":\"No\",\"lastDetected\":\"2025-04-03T10:38:59.297015+00:00\",\"matchCriteriaString\":\"OS\",\"recommendedSteps\":null,\"remediationTypes\":null,\"status\":\"Open\",\"statusChangeReason\":null,\"statusSource\":\"Discovered by Armis\"}}",
        "start": "2025-04-03T09:18:31.915Z",
        "type": [
            "info"
        ]
    },
    "host": {
        "id": "109"
    },
    "input": {
        "type": "cel"
    },
    "message": "This issue was addressed with improved validation of file attributes.",
    "observer": {
        "product": "Asset Management and Security",
        "vendor": "Armis"
    },
    "related": {
        "hosts": [
            "109"
        ]
    },
    "tags": [
        "preserve_original_event",
        "preserve_duplicate_custom_fields",
        "forwarded",
        "armis-vulnerability"
    ],
    "threat": {
        "indicator": {
            "last_seen": "2025-04-03T10:38:59.297Z"
        }
    },
    "vulnerability": {
        "category": [
            "Network"
        ],
        "description": "This issue was addressed with improved validation of file attributes.",
        "id": "CVE-2024-44148",
        "scanner": {
            "vendor": "Armis"
        },
        "severity": "Critical"
    }
}
Exported fields
| Field | Description | Type |
|---|---|---|
| @timestamp | Event timestamp. | date |
| armis.vulnerability.affected_devices_count | long | |
| armis.vulnerability.attack_complexity | keyword | |
| armis.vulnerability.attack_vector | keyword | |
| armis.vulnerability.availability_impact | keyword | |
| armis.vulnerability.avm_rating | keyword | |
| armis.vulnerability.avm_rating_manual_change_reason | keyword | |
| armis.vulnerability.avm_rating_manual_changed_by | keyword | |
| armis.vulnerability.avm_rating_manual_update_time | date | |
| armis.vulnerability.botnets | keyword | |
| armis.vulnerability.cisa_due_date | date | |
| armis.vulnerability.common_name | keyword | |
| armis.vulnerability.confidentiality_impact | keyword | |
| armis.vulnerability.cve_uid | keyword | |
| armis.vulnerability.cvss_score | double | |
| armis.vulnerability.cvss_score_v4 | keyword | |
| armis.vulnerability.description | keyword | |
| armis.vulnerability.epss_percentile | double | |
| armis.vulnerability.epss_score | double | |
| armis.vulnerability.exploitability_score | double | |
| armis.vulnerability.first_detected | date | |
| armis.vulnerability.first_reference_publish_date | date | |
| armis.vulnerability.first_weaponized_reference_publish_date | date | |
| armis.vulnerability.has_ransomware | boolean | |
| armis.vulnerability.has_remediation_info | keyword | |
| armis.vulnerability.id | keyword | |
| armis.vulnerability.impact_score | double | |
| armis.vulnerability.integrity_impact | keyword | |
| armis.vulnerability.is_weaponized | boolean | |
| armis.vulnerability.last_detected | date | |
| armis.vulnerability.latest_exploit_update | date | |
| armis.vulnerability.num_of_exploits | long | |
| armis.vulnerability.number_of_threat_actors | long | |
| armis.vulnerability.privileges_required | keyword | |
| armis.vulnerability.published_date | date | |
| armis.vulnerability.reported_by_google_zero_days | boolean | |
| armis.vulnerability.scope | keyword | |
| armis.vulnerability.score | double | |
| armis.vulnerability.severity | keyword | |
| armis.vulnerability.status | keyword | |
| armis.vulnerability.threat_actors | keyword | |
| armis.vulnerability.threat_tags | keyword | |
| armis.vulnerability.type | keyword | |
| armis.vulnerability.user_interaction | keyword | |
| armis.vulnerability.vulnerability_match.advisory_id | keyword | |
| armis.vulnerability.vulnerability_match.avm_rating | keyword | |
| armis.vulnerability.vulnerability_match.confidence_level | keyword | |
| armis.vulnerability.vulnerability_match.confidence_level_description | keyword | |
| armis.vulnerability.vulnerability_match.cve_uid | keyword | |
| armis.vulnerability.vulnerability_match.device_id | keyword | |
| armis.vulnerability.vulnerability_match.first_detected | date | |
| armis.vulnerability.vulnerability_match.has_remediation_info | keyword | |
| armis.vulnerability.vulnerability_match.last_detected | date | |
| armis.vulnerability.vulnerability_match.match_criteria_string | keyword | |
| armis.vulnerability.vulnerability_match.recommended_steps | keyword | |
| armis.vulnerability.vulnerability_match.remediation_types | keyword | |
| armis.vulnerability.vulnerability_match.status | keyword | |
| armis.vulnerability.vulnerability_match.status_change_reason | keyword | |
| armis.vulnerability.vulnerability_match.status_source | keyword | |
| data_stream.dataset | Data stream dataset. | constant_keyword |
| data_stream.namespace | Data stream namespace. | constant_keyword |
| data_stream.type | Data stream type. | constant_keyword |
| event.dataset | Event dataset. | constant_keyword |
| event.module | Event module. | constant_keyword |
| input.type | Type of filebeat input. | keyword |
| labels.is_transform_source | Distinguishes between documents that are a source for a transform and documents that are an output of a transform, to facilitate easier filtering. | constant_keyword |
| log.offset | Log offset. | long |
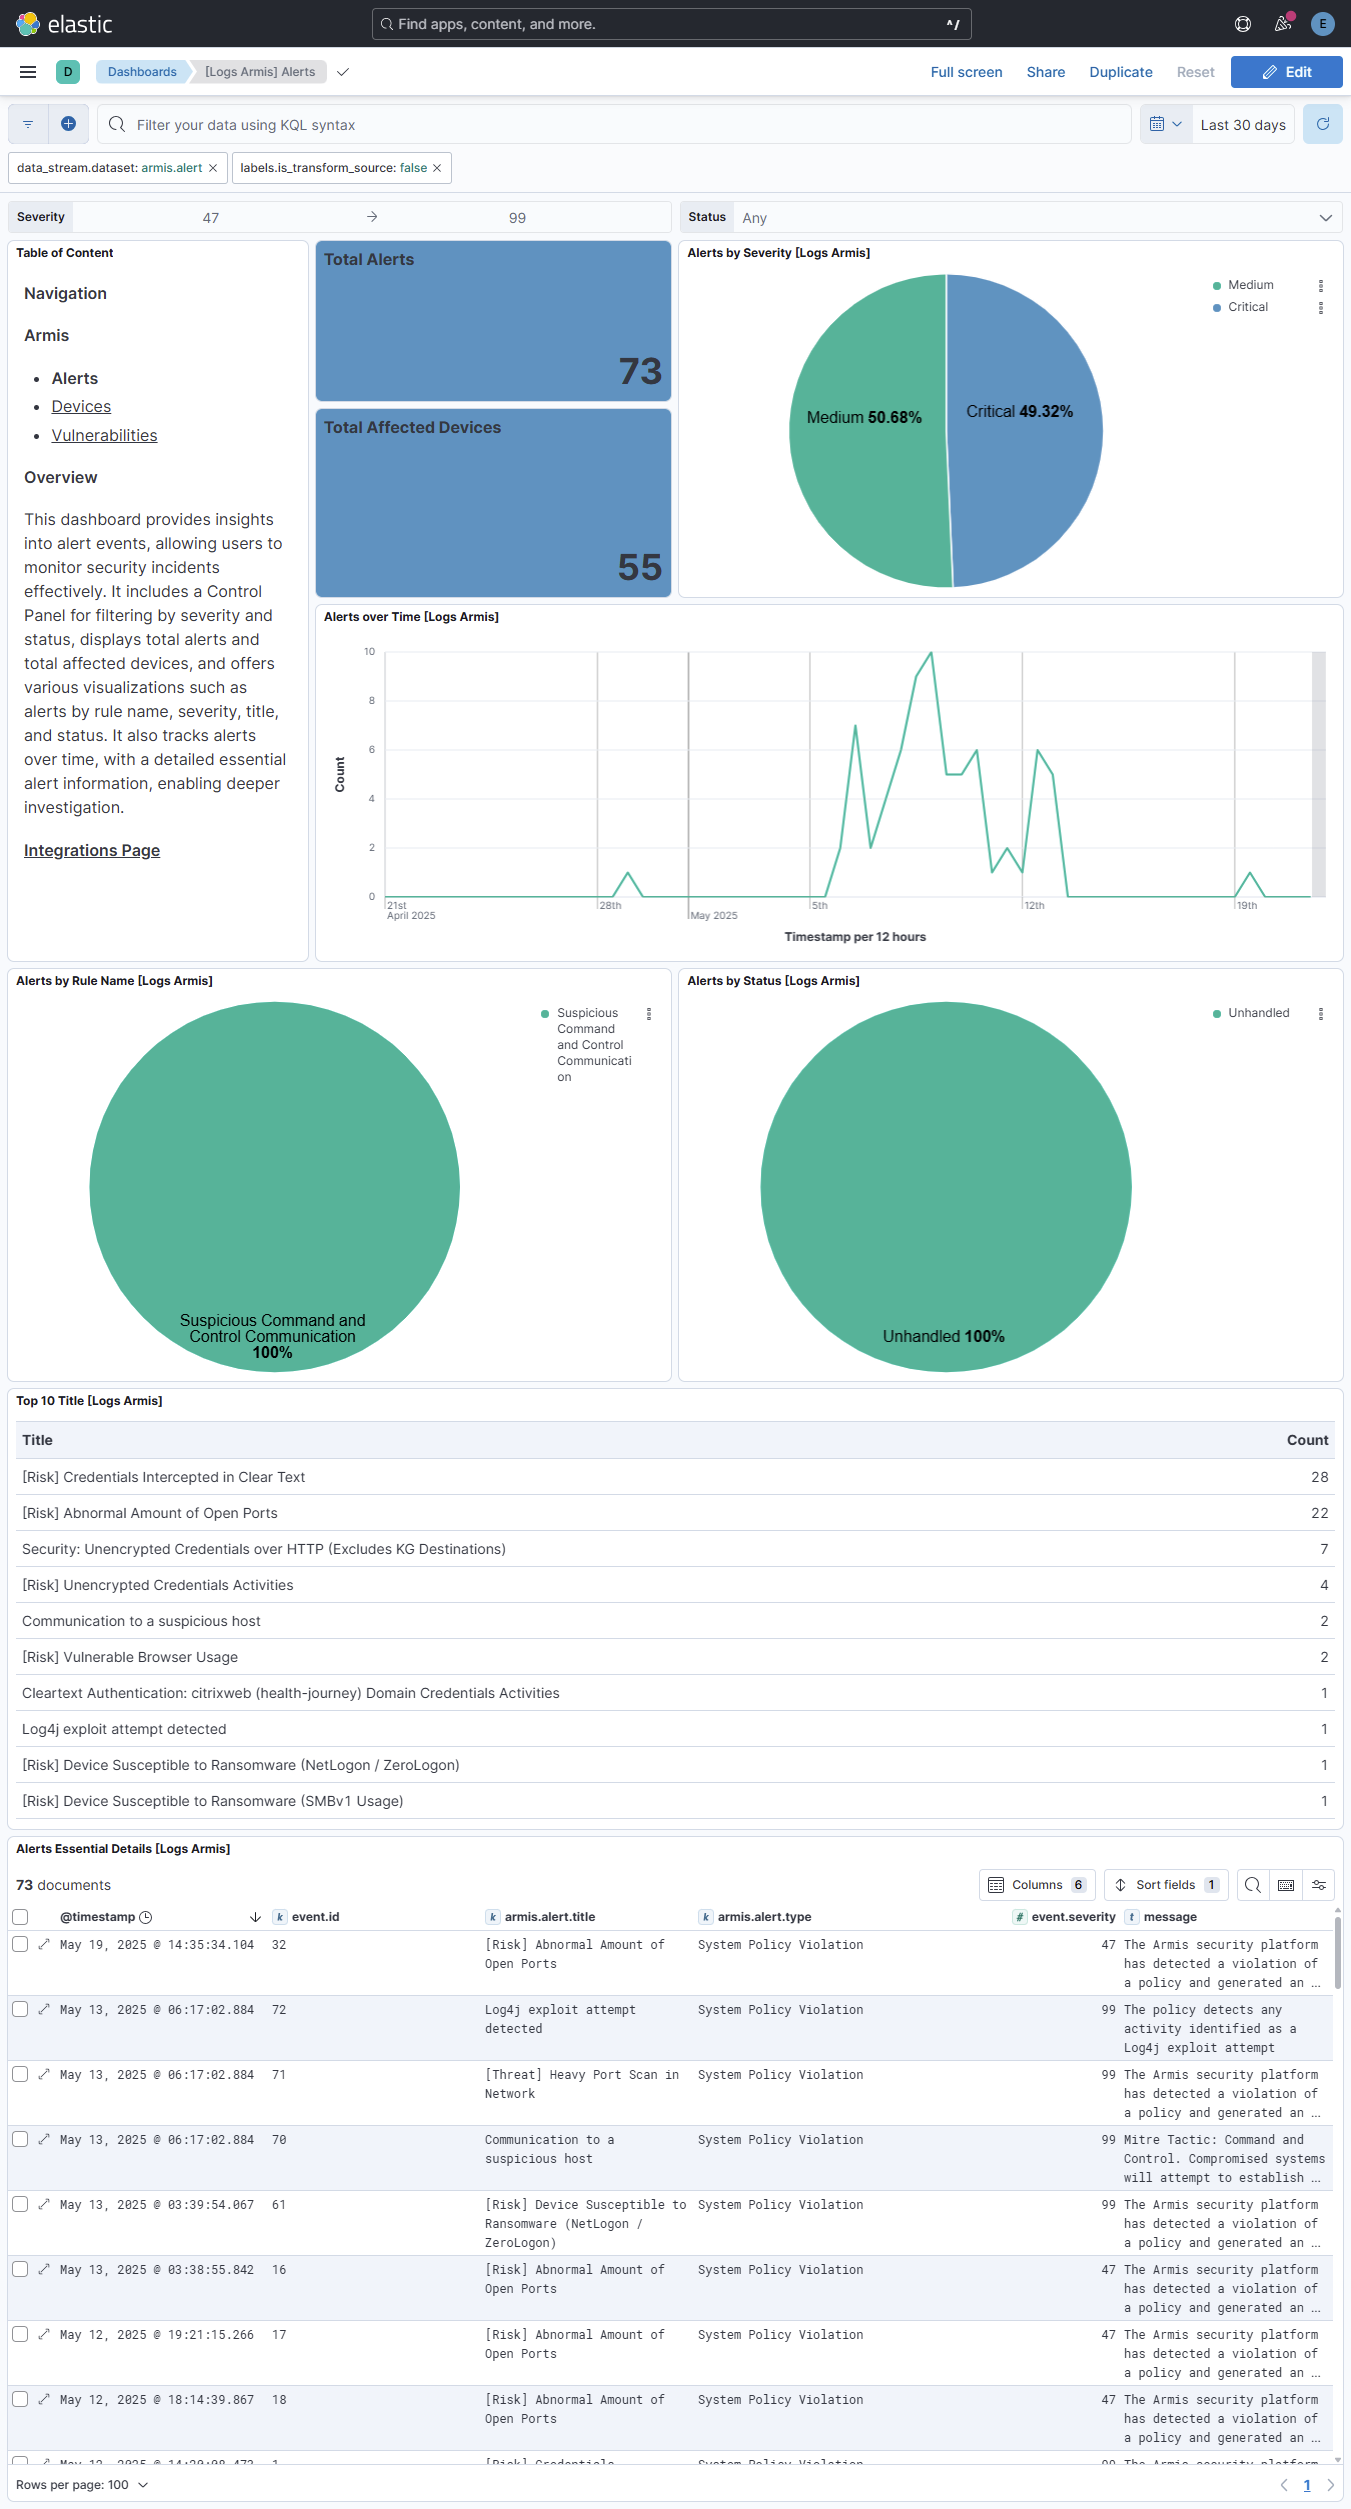
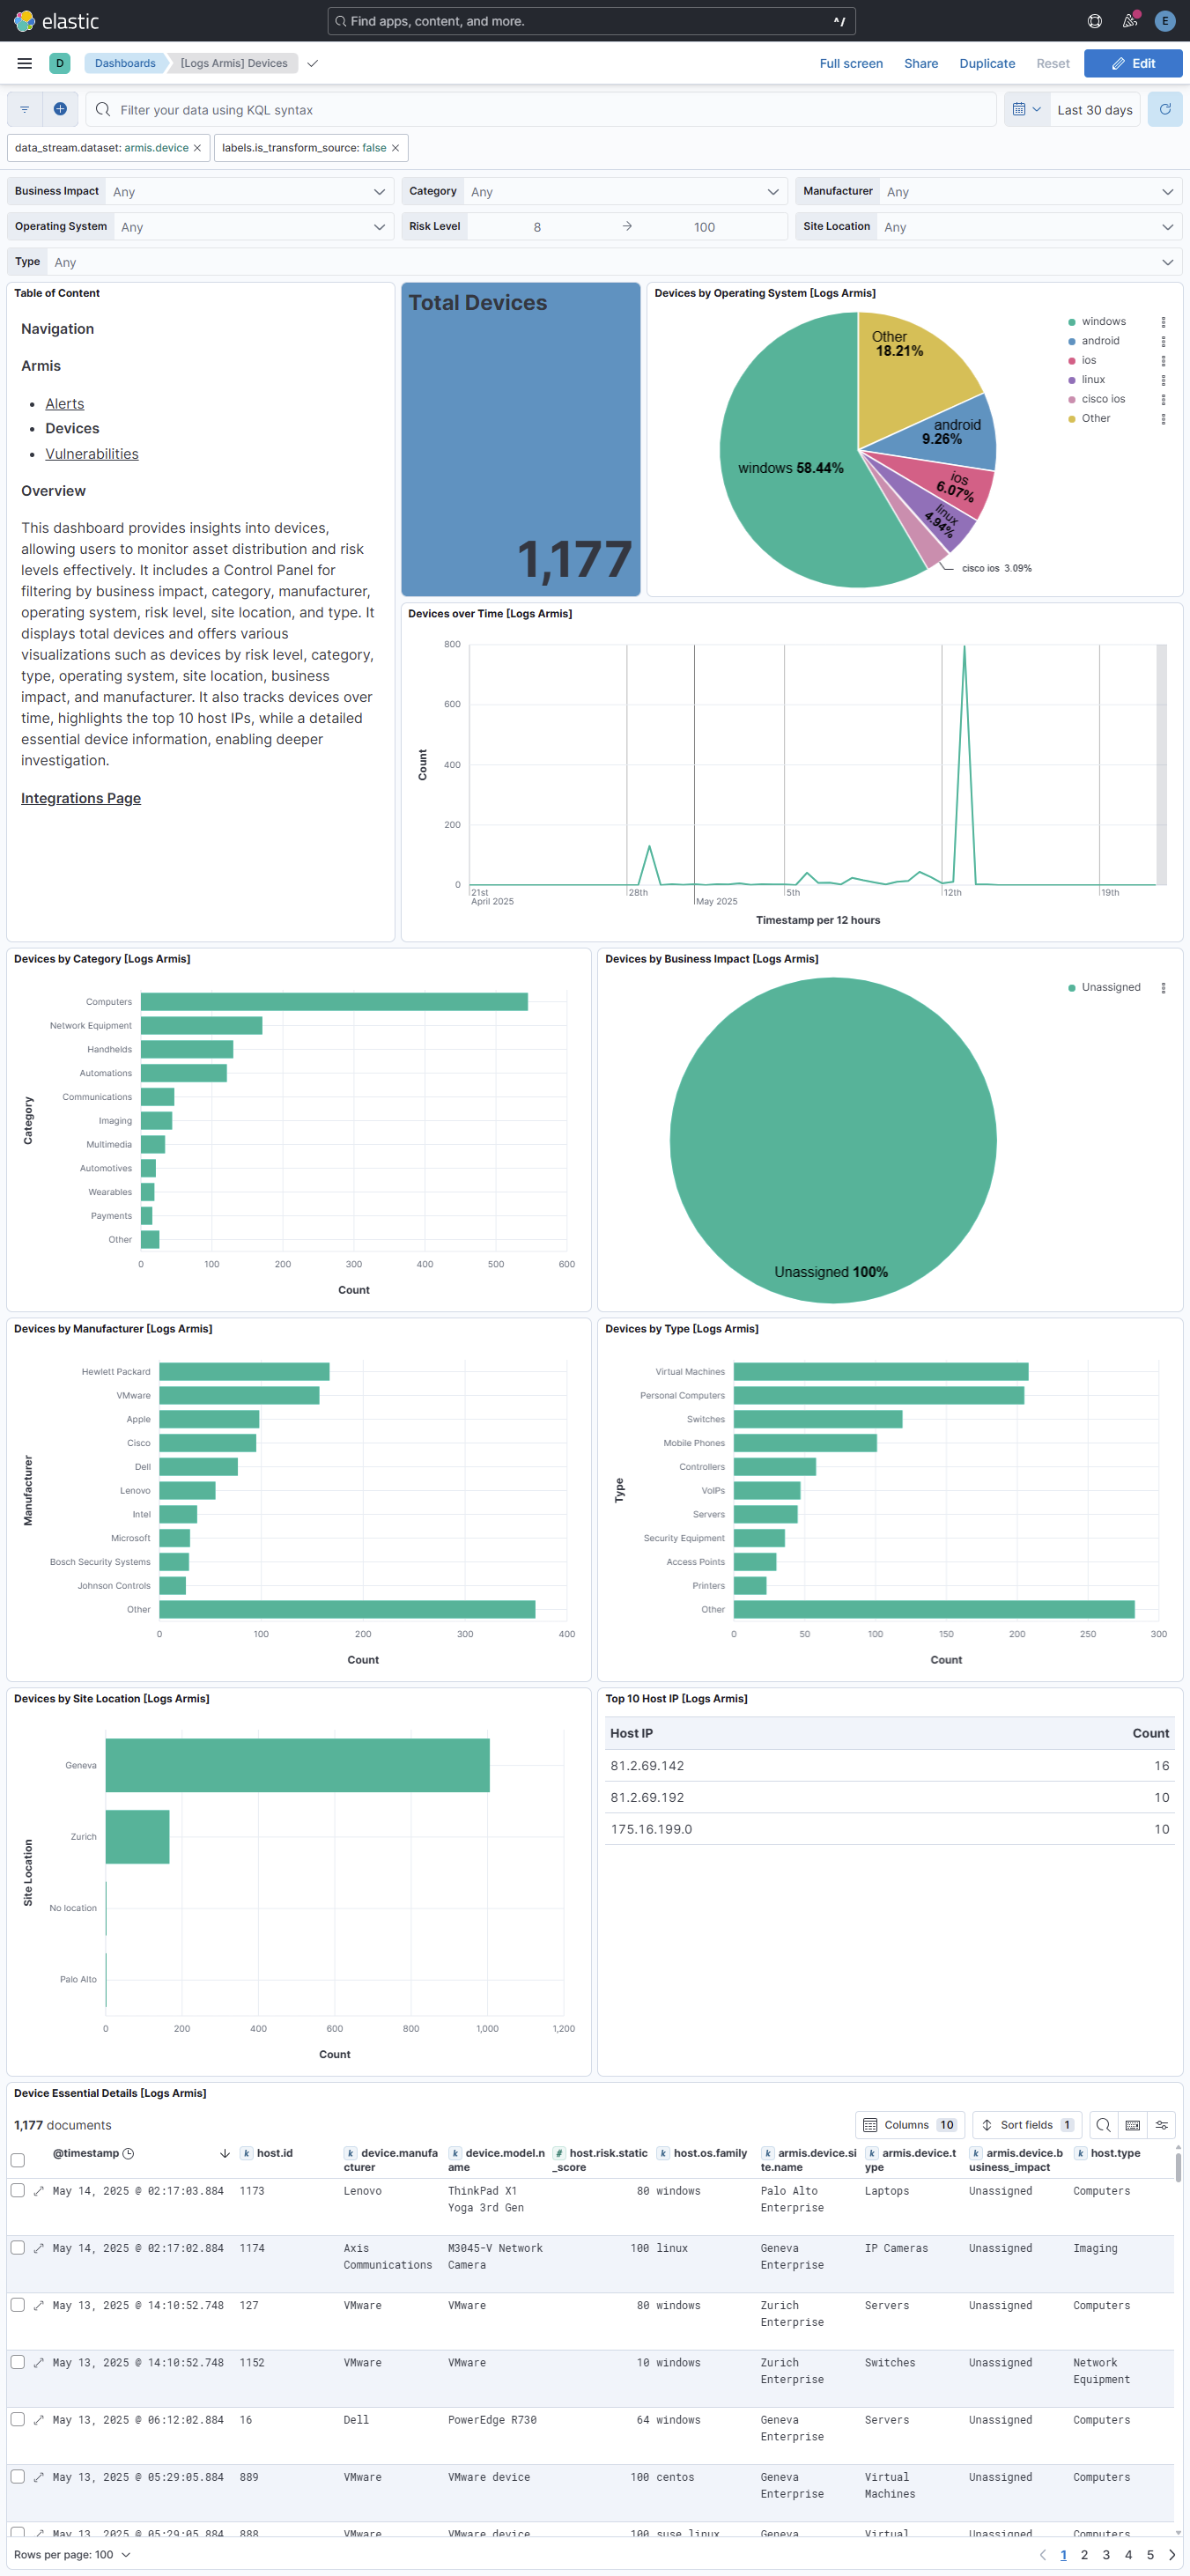
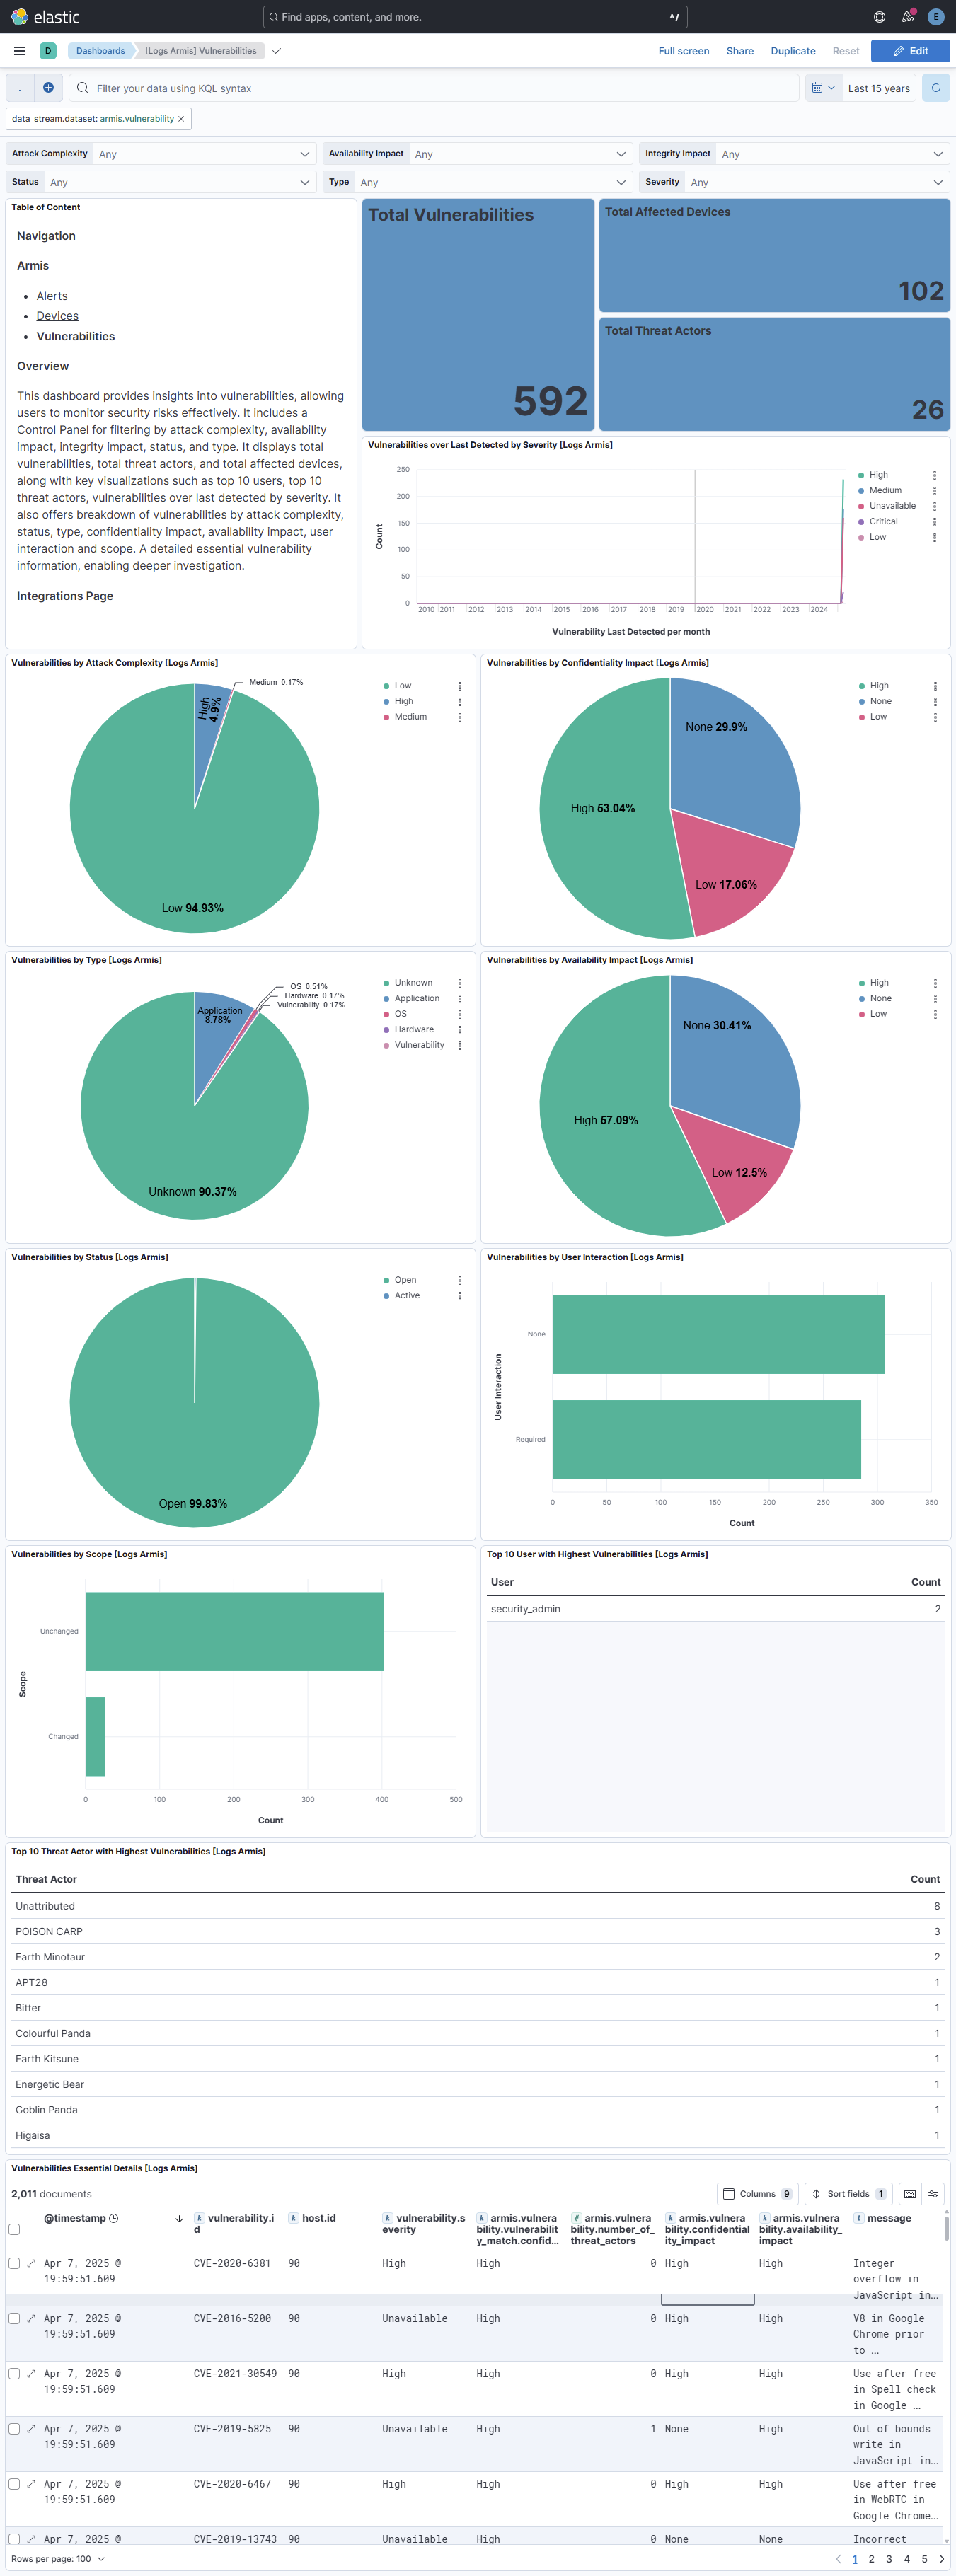
This integration includes one or more Kibana dashboards that visualizes the data collected by the integration. The screenshots below illustrate how the ingested data is displayed.
Changelog
| Version | Details | Kibana version(s) |
|---|---|---|
| 0.4.1 | Bug fix (View pull request) Downgrade the format_version to the minimum version that supports all the necessary features for the package. |
— |
| 0.4.0 | Enhancement (View pull request) Improve documentation to align with new guidelines. |
— |
| 0.3.0 | Enhancement (View pull request) Use terminate processor instead of fail processor to handle agent errors. |
— |
| 0.2.0 | Enhancement (View pull request) Remove duplicated installation instructions from the documentation. |
— |
| 0.1.1 | Bug fix (View pull request) Add temporary processor to remove the fields added by the Agentless policy. |
— |
| 0.1.0 | Enhancement (View pull request) Initial release. |
— |


