---
title: Grafana Integration
description: The Grafana integration collects metrics and logs from Grafana instances using Elastic Agent. This integration has been tested with Grafana versions 10.x,...
url: https://www.elastic.co/docs/reference/integrations/grafana
products:
- Elastic integrations
applies_to:
- Serverless Observability projects: Preview
- Serverless Security projects: Preview
- Elastic Stack: Preview since 9.0
---
# Grafana Integration
| | |
|-------------------------------------------------------------------------------------------------|-------------------------------------------------------------------|
| **Version** | 0.1.0 : Preview ([View all](#changelog)) |
| **Subscription level**[What's this?](https://www.elastic.co/subscriptions) | Basic |
| **Developed by**[What's this?](https://www.elastic.co/docs/reference/integrations/developed-by) | Community |
| **Ingestion method(s)** | File, Prometheus |
| **Minimum Kibana version(s)** | 9.0.08.16.0 |
To use pre-release integrations, go to the **Integrations** page in Kibana, scroll down, and toggle on the _Display beta integrations_ option.
The Grafana integration collects metrics and logs from [Grafana](https://grafana.com/) instances using Elastic Agent.
## Compatibility
This integration has been tested with Grafana versions 10.x, 11.x, and 12.x.
## Data Streams
### Metrics
The `metrics` data stream scrapes Prometheus metrics from Grafana's `/metrics` endpoint. It collects application-level metrics (HTTP performance, alerting, datasource requests, database connections, instance stats) and Go runtime metrics (CPU, memory, goroutines, file descriptors).
Grafana must have metrics enabled (`GF_METRICS_ENABLED=true` or `[metrics] enabled = true` in `grafana.ini`). Metrics are enabled by default.
```json
{
"@timestamp": "2026-02-16T21:00:00.000Z",
"data_stream": {
"type": "metrics",
"dataset": "grafana.metrics",
"namespace": "default"
},
"event": {
"kind": "metric",
"module": "grafana",
"dataset": "grafana.metrics"
},
"grafana": {
"stat": {
"dashboards": {
"total": 35
},
"users": {
"total": 1,
"active": 1
},
"datasources": {
"total": 5
},
"alert_rules": {
"total": 0
},
"orgs": {
"total": 1
},
"folders": {
"total": 8
},
"admins": {
"total": 1
},
"editors": {
"total": 1
},
"viewers": {
"total": 0
}
},
"alerting": {
"active_alerts": 0,
"active_configurations": 1,
"ticker": {
"interval_seconds": 10
}
},
"database": {
"connections": {
"open": 2,
"in_use": 0,
"idle": 2,
"max_open": 0
}
},
"api": {
"login": {
"post": {
"total": 1
}
}
},
"authentication": {
"attempts": 850
},
"build_info": {
"_value": 1
},
"process": {
"cpu": {
"seconds": {
"total": 94.98
}
},
"memory": {
"resident_bytes": 282255360,
"virtual_bytes": 1800351744
},
"open_fds": 19,
"max_fds": 10000
},
"go": {
"goroutines": 388,
"threads": 17,
"memstats": {
"heap_alloc_bytes": 58324944,
"alloc_bytes": 58324944,
"sys_bytes": 138340632
},
"gc": {
"duration": {
"count": 180,
"seconds": 0.025293074
}
}
}
},
"service": {
"address": "grafana:3000",
"name": "grafana"
},
"host": {
"name": "grafana-host"
}
}
```
**ECS Field Reference**
Refer to the following [document](https://www.elastic.co/guide/en/ecs/current/ecs-field-reference.html) for detailed information on ECS fields.
| Field | Description | Type | Unit | Metric Type |
|------------------------------------------------------|----------------------------------------------------------|------------------|------|-------------|
| @timestamp | Event timestamp. | date | | |
| cloud.account.id | Cloud account ID. | keyword | | |
| cloud.availability_zone | Cloud availability zone. | keyword | | |
| cloud.image.id | Image ID for the cloud instance. | keyword | | |
| cloud.instance.id | Cloud instance ID. | keyword | | |
| cloud.provider | Cloud provider name. | keyword | | |
| cloud.region | Cloud region. | keyword | | |
| container.id | Container ID. | keyword | | |
| data_stream.dataset | Data stream dataset. | constant_keyword | | |
| data_stream.namespace | Data stream namespace. | constant_keyword | | |
| data_stream.type | Data stream type. | constant_keyword | | |
| event.dataset | Event dataset. | constant_keyword | | |
| event.module | Event module. | constant_keyword | | |
| grafana.alerting.active_alerts | Number of active alerts. | long | | gauge |
| grafana.alerting.active_configurations | Number of active alerting configurations. | long | | gauge |
| grafana.alerting.alerts | Number of alerts by state. | long | | gauge |
| grafana.alerting.alerts_invalid.total | Total invalid alerts received. | long | | counter |
| grafana.alerting.alerts_received.total | Total alerts received. | long | | counter |
| grafana.alerting.execution_time.count | Alert execution time observation count. | long | | counter |
| grafana.alerting.execution_time.milliseconds | Alert execution time sum in milliseconds. | double | | counter |
| grafana.alerting.notification.failed.total | Alert notifications failed by type. | long | | counter |
| grafana.alerting.notification.sent.total | Alert notifications sent by type. | long | | counter |
| grafana.alerting.notification_latency.count | Alert notification latency count. | long | | counter |
| grafana.alerting.notification_latency.seconds | Alert notification latency sum in seconds. | double | | counter |
| grafana.alerting.result.total | Alert execution results by state. | long | | counter |
| grafana.alerting.schedule.alert_rules | Number of alert rules scheduled. | long | | gauge |
| grafana.alerting.scheduler.behind_seconds | How far behind the alerting scheduler is in seconds. | double | | gauge |
| grafana.alerting.silences | Number of silences by state. | long | | gauge |
| grafana.alerting.ticker.interval_seconds | Alerting ticker interval in seconds. | double | | gauge |
| grafana.api.dashboard.get.count | Dashboard GET request count. | long | | counter |
| grafana.api.dashboard.get.milliseconds | Dashboard GET request duration quantile in milliseconds. | double | | gauge |
| grafana.api.dashboard.get.sum | Dashboard GET request duration sum in milliseconds. | double | | counter |
| grafana.api.dashboard.insert.total | Total dashboard inserts. | long | | counter |
| grafana.api.dashboard.save.count | Dashboard save request count. | long | | counter |
| grafana.api.dashboard.save.milliseconds | Dashboard save duration quantile in milliseconds. | double | | gauge |
| grafana.api.dashboard.save.sum | Dashboard save duration sum in milliseconds. | double | | counter |
| grafana.api.dashboard.search.count | Dashboard search request count. | long | | counter |
| grafana.api.dashboard.search.milliseconds | Dashboard search duration quantile in milliseconds. | double | | gauge |
| grafana.api.dashboard.search.sum | Dashboard search duration sum in milliseconds. | double | | counter |
| grafana.api.dashboard.snapshot.create.total | Total dashboard snapshots created. | long | | counter |
| grafana.api.dashboard.snapshot.get.total | Total dashboard snapshot retrievals. | long | | counter |
| grafana.api.dataproxy.request.count | Data proxy request count. | long | | counter |
| grafana.api.dataproxy.request.milliseconds | Data proxy request duration quantile in milliseconds. | double | | gauge |
| grafana.api.dataproxy.request.sum | Data proxy request duration sum in milliseconds. | double | | counter |
| grafana.api.login.oauth.total | Total OAuth login attempts. | long | | counter |
| grafana.api.login.post.total | Total POST login attempts. | long | | counter |
| grafana.api.response.status.total | Total API responses by status code. | long | | counter |
| grafana.authentication.attempts | Total authentication attempts. | long | | counter |
| grafana.authentication.failed.total | Total failed authentications. | long | | counter |
| grafana.authentication.successful.total | Total successful authentications. | long | | counter |
| grafana.authentication.user_requests | Authenticated user requests. | long | | counter |
| grafana.build_info._value | Build info metric value (always 1). | double | | gauge |
| grafana.build_info.edition | Grafana edition (oss or enterprise). | keyword | | |
| grafana.build_info.timestamp | Build timestamp. | double | | gauge |
| grafana.build_info.version | Grafana version from build info. | keyword | | |
| grafana.database.connections.idle | Idle database connections. | long | | gauge |
| grafana.database.connections.in_use | In-use database connections. | long | | gauge |
| grafana.database.connections.max_idle_closed | Total connections closed due to max idle limit. | long | | counter |
| grafana.database.connections.max_idle_closed_seconds | Total time of max idle closed connections. | double | | counter |
| grafana.database.connections.max_lifetime_closed | Total connections closed due to max lifetime. | long | | counter |
| grafana.database.connections.max_open | Maximum open database connections allowed. | long | | gauge |
| grafana.database.connections.open | Open database connections. | long | | gauge |
| grafana.database.connections.wait_count | Total connection wait count. | long | | counter |
| grafana.database.connections.wait_duration_seconds | Total time blocked waiting for a connection in seconds. | double | | counter |
| grafana.datasource.query_by_id.total | Total datasource queries by ID. | long | | counter |
| grafana.datasource.request.total | Total datasource requests. | long | | counter |
| grafana.emails.sent.failed | Total emails failed to send. | long | | counter |
| grafana.emails.sent.total | Total emails sent. | long | | counter |
| grafana.environment_info._value | Environment info metric value (always 1). | double | | gauge |
| grafana.frontend.boot.fcp.count | First Contentful Paint observation count. | long | | counter |
| grafana.frontend.boot.fcp.seconds | First Contentful Paint time sum in seconds. | double | | counter |
| grafana.frontend.boot.load_time.count | Frontend boot load time observation count. | long | | counter |
| grafana.frontend.boot.load_time.seconds | Frontend boot load time sum in seconds. | double | | counter |
| grafana.go.gc.duration.count | GC pause count. | long | | counter |
| grafana.go.gc.duration.seconds | GC pause duration sum in seconds. | double | | counter |
| grafana.go.goroutines | Number of goroutines. | long | | gauge |
| grafana.go.memstats.alloc_bytes | Bytes allocated and in use. | long | byte | gauge |
| grafana.go.memstats.alloc_bytes_total | Total bytes allocated even if freed. | long | byte | counter |
| grafana.go.memstats.buck_hash_sys_bytes | Bytes used by profiling bucket hash table. | long | byte | gauge |
| grafana.go.memstats.frees_total | Total number of heap object frees. | long | | counter |
| grafana.go.memstats.gc_sys_bytes | Bytes used for GC metadata. | long | byte | gauge |
| grafana.go.memstats.heap_alloc_bytes | Heap bytes allocated and in use. | long | byte | gauge |
| grafana.go.memstats.heap_idle_bytes | Heap bytes waiting to be used. | long | byte | gauge |
| grafana.go.memstats.heap_inuse_bytes | Heap bytes in use by spans. | long | byte | gauge |
| grafana.go.memstats.heap_objects | Number of allocated heap objects. | long | | gauge |
| grafana.go.memstats.heap_released_bytes | Heap bytes released to the OS. | long | byte | gauge |
| grafana.go.memstats.heap_sys_bytes | Heap bytes obtained from the OS. | long | byte | gauge |
| grafana.go.memstats.last_gc_time_seconds | Last GC time in seconds since epoch. | double | | gauge |
| grafana.go.memstats.mallocs_total | Total number of heap object allocations. | long | | counter |
| grafana.go.memstats.mcache_inuse_bytes | MCache structures in use. | long | byte | gauge |
| grafana.go.memstats.mcache_sys_bytes | MCache structures obtained from OS. | long | byte | gauge |
| grafana.go.memstats.mspan_inuse_bytes | MSpan structures in use. | long | byte | gauge |
| grafana.go.memstats.mspan_sys_bytes | MSpan structures obtained from OS. | long | byte | gauge |
| grafana.go.memstats.next_gc_bytes | Target heap size for next GC cycle. | long | byte | gauge |
| grafana.go.memstats.other_sys_bytes | Other system bytes. | long | byte | gauge |
| grafana.go.memstats.stack_inuse_bytes | Stack bytes in use. | long | byte | gauge |
| grafana.go.memstats.stack_sys_bytes | Stack bytes obtained from the OS. | long | byte | gauge |
| grafana.go.memstats.sys_bytes | Total bytes of memory obtained from the OS. | long | byte | gauge |
| grafana.go.threads | Number of OS threads created. | long | | gauge |
| grafana.http.request.count | HTTP request count by handler, method, and status code. | long | | counter |
| grafana.http.request.duration.seconds | HTTP request duration sum in seconds. | double | | counter |
| grafana.http.request.in_flight | Number of HTTP requests currently in flight. | long | | gauge |
| grafana.http.response.size.bytes | HTTP response size sum in bytes. | double | | counter |
| grafana.http.response.size.count | HTTP response count by handler. | long | | counter |
| grafana.instance.id | Unique Grafana instance identifier. | keyword | | |
| grafana.instance.start_total | Total instance starts. | long | | counter |
| grafana.live.channels | Number of live channels. | long | | gauge |
| grafana.live.clients | Number of live clients. | long | | gauge |
| grafana.live.subscriptions | Number of live subscriptions. | long | | gauge |
| grafana.live.users | Number of live users. | long | | gauge |
| grafana.page.response.status.total | Total page responses by status code. | long | | counter |
| grafana.process.cpu.seconds.total | Total user and system CPU time in seconds. | double | | counter |
| grafana.process.max_fds | Maximum number of file descriptors. | long | | gauge |
| grafana.process.memory.resident_bytes | Resident memory size in bytes. | long | byte | gauge |
| grafana.process.memory.virtual_bytes | Virtual memory size in bytes. | long | byte | gauge |
| grafana.process.network.receive_bytes | Network bytes received. | long | byte | counter |
| grafana.process.network.transmit_bytes | Network bytes transmitted. | long | byte | counter |
| grafana.process.open_fds | Number of open file descriptors. | long | | gauge |
| grafana.process.start_time_seconds | Process start time in seconds since epoch. | double | | gauge |
| grafana.proxy.response.status.total | Total proxy responses by status code. | long | | counter |
| grafana.public_dashboard.request_count | Public dashboard request count. | long | | counter |
| grafana.rendering.queue_size | Rendering queue size. | long | | gauge |
| grafana.stat.active_admins.total | Active admin users. | long | | gauge |
| grafana.stat.active_editors.total | Active editor users. | long | | gauge |
| grafana.stat.active_viewers.total | Active viewer users. | long | | gauge |
| grafana.stat.admins.total | Total admin users. | long | | gauge |
| grafana.stat.alert_rules.total | Total alert rules. | long | | gauge |
| grafana.stat.annotations.total | Total annotations. | long | | gauge |
| grafana.stat.correlations.total | Total correlations. | long | | gauge |
| grafana.stat.dashboard_versions.total | Total dashboard versions. | long | | gauge |
| grafana.stat.dashboards.total | Total number of dashboards. | long | | gauge |
| grafana.stat.data_keys.total | Total data keys. | long | | gauge |
| grafana.stat.datasources.total | Total datasources. | long | | gauge |
| grafana.stat.editors.total | Total editor users. | long | | gauge |
| grafana.stat.folders.total | Total folders. | long | | gauge |
| grafana.stat.library_panels.total | Total library panels. | long | | gauge |
| grafana.stat.orgs.total | Total organizations. | long | | gauge |
| grafana.stat.playlists.total | Total playlists. | long | | gauge |
| grafana.stat.public_dashboards.total | Total public dashboards. | long | | gauge |
| grafana.stat.repositories.total | Total repositories. | long | | gauge |
| grafana.stat.rule_groups.total | Total rule groups. | long | | gauge |
| grafana.stat.service_accounts.total | Total service accounts. | long | | gauge |
| grafana.stat.teams.total | Total teams. | long | | gauge |
| grafana.stat.users.active | Active users. | long | | gauge |
| grafana.stat.users.total | Total users. | long | | gauge |
| grafana.stat.viewers.total | Total viewer users. | long | | gauge |
| host.containerized | Whether the host is a container. | boolean | | |
| host.name | Host name. | keyword | | |
| host.os.build | OS build information. | keyword | | |
| host.os.codename | OS codename, if any. | keyword | | |
| prometheus.labels.* | Prometheus metric labels. | keyword | | |
### Logs
The `logs` data stream collects Grafana server logs from file. Both JSON and logfmt (the default) formats are supported. To use JSON logging, set `format = json` under `[log.file]` in `grafana.ini` or set the `GF_LOG_FILE_FORMAT=json` environment variable.
```json
{
"@timestamp": "2026-02-16T20:59:08.907Z",
"data_stream": {
"type": "logs",
"dataset": "grafana.logs",
"namespace": "default"
},
"event": {
"kind": "event",
"module": "grafana",
"dataset": "grafana.logs",
"severity": 6,
"duration": 9376553
},
"log": {
"level": "info",
"logger": "context"
},
"message": "Request Completed",
"http": {
"request": {
"method": "GET"
},
"response": {
"status_code": -1,
"body": {
"bytes": 0
}
}
},
"url": {
"path": "/api/live/ws"
},
"client": {
"ip": "172.30.0.1"
},
"user": {
"name": "admin"
},
"grafana": {
"log": {
"orgId": 1,
"handler": "/api/live/ws"
}
},
"host": {
"name": "grafana-host"
}
}
```
**ECS Field Reference**
Refer to the following [document](https://www.elastic.co/guide/en/ecs/current/ecs-field-reference.html) for detailed information on ECS fields.
| Field | Description | Type |
|-------------------------|----------------------------------|------------------|
| @timestamp | Event timestamp. | date |
| cloud.account.id | Cloud account ID. | keyword |
| cloud.availability_zone | Cloud availability zone. | keyword |
| cloud.image.id | Image ID for the cloud instance. | keyword |
| cloud.instance.id | Cloud instance ID. | keyword |
| cloud.provider | Cloud provider name. | keyword |
| cloud.region | Cloud region. | keyword |
| container.id | Container ID. | keyword |
| data_stream.dataset | Data stream dataset. | constant_keyword |
| data_stream.namespace | Data stream namespace. | constant_keyword |
| data_stream.type | Data stream type. | constant_keyword |
| event.dataset | Event dataset. | constant_keyword |
| event.module | Event module. | constant_keyword |
| grafana.log.handler | Request handler name. | keyword |
| grafana.log.orgId | Organization ID in context. | long |
| grafana.log.subUrl | Grafana sub-URL prefix. | keyword |
| host.containerized | Whether the host is a container. | boolean |
| host.name | Host name. | keyword |
| host.os.build | OS build information. | keyword |
| host.os.codename | OS codename, if any. | keyword |
| input.type | Type of Filebeat input. | keyword |
| log.offset | Log offset. | long |
## Setup
1. Add the Grafana integration in Fleet.
2. Configure the **Grafana Hosts** to point at your Grafana instance(s), for example `http://grafana:3000`.
3. For logs, set the **Log Paths** to the location of your Grafana log file(s), for example `/var/log/grafana/grafana.log`.
4. If your `/metrics` endpoint requires authentication, provide the **Username** and **Password**.
## Dashboards
The integration includes two dashboards:
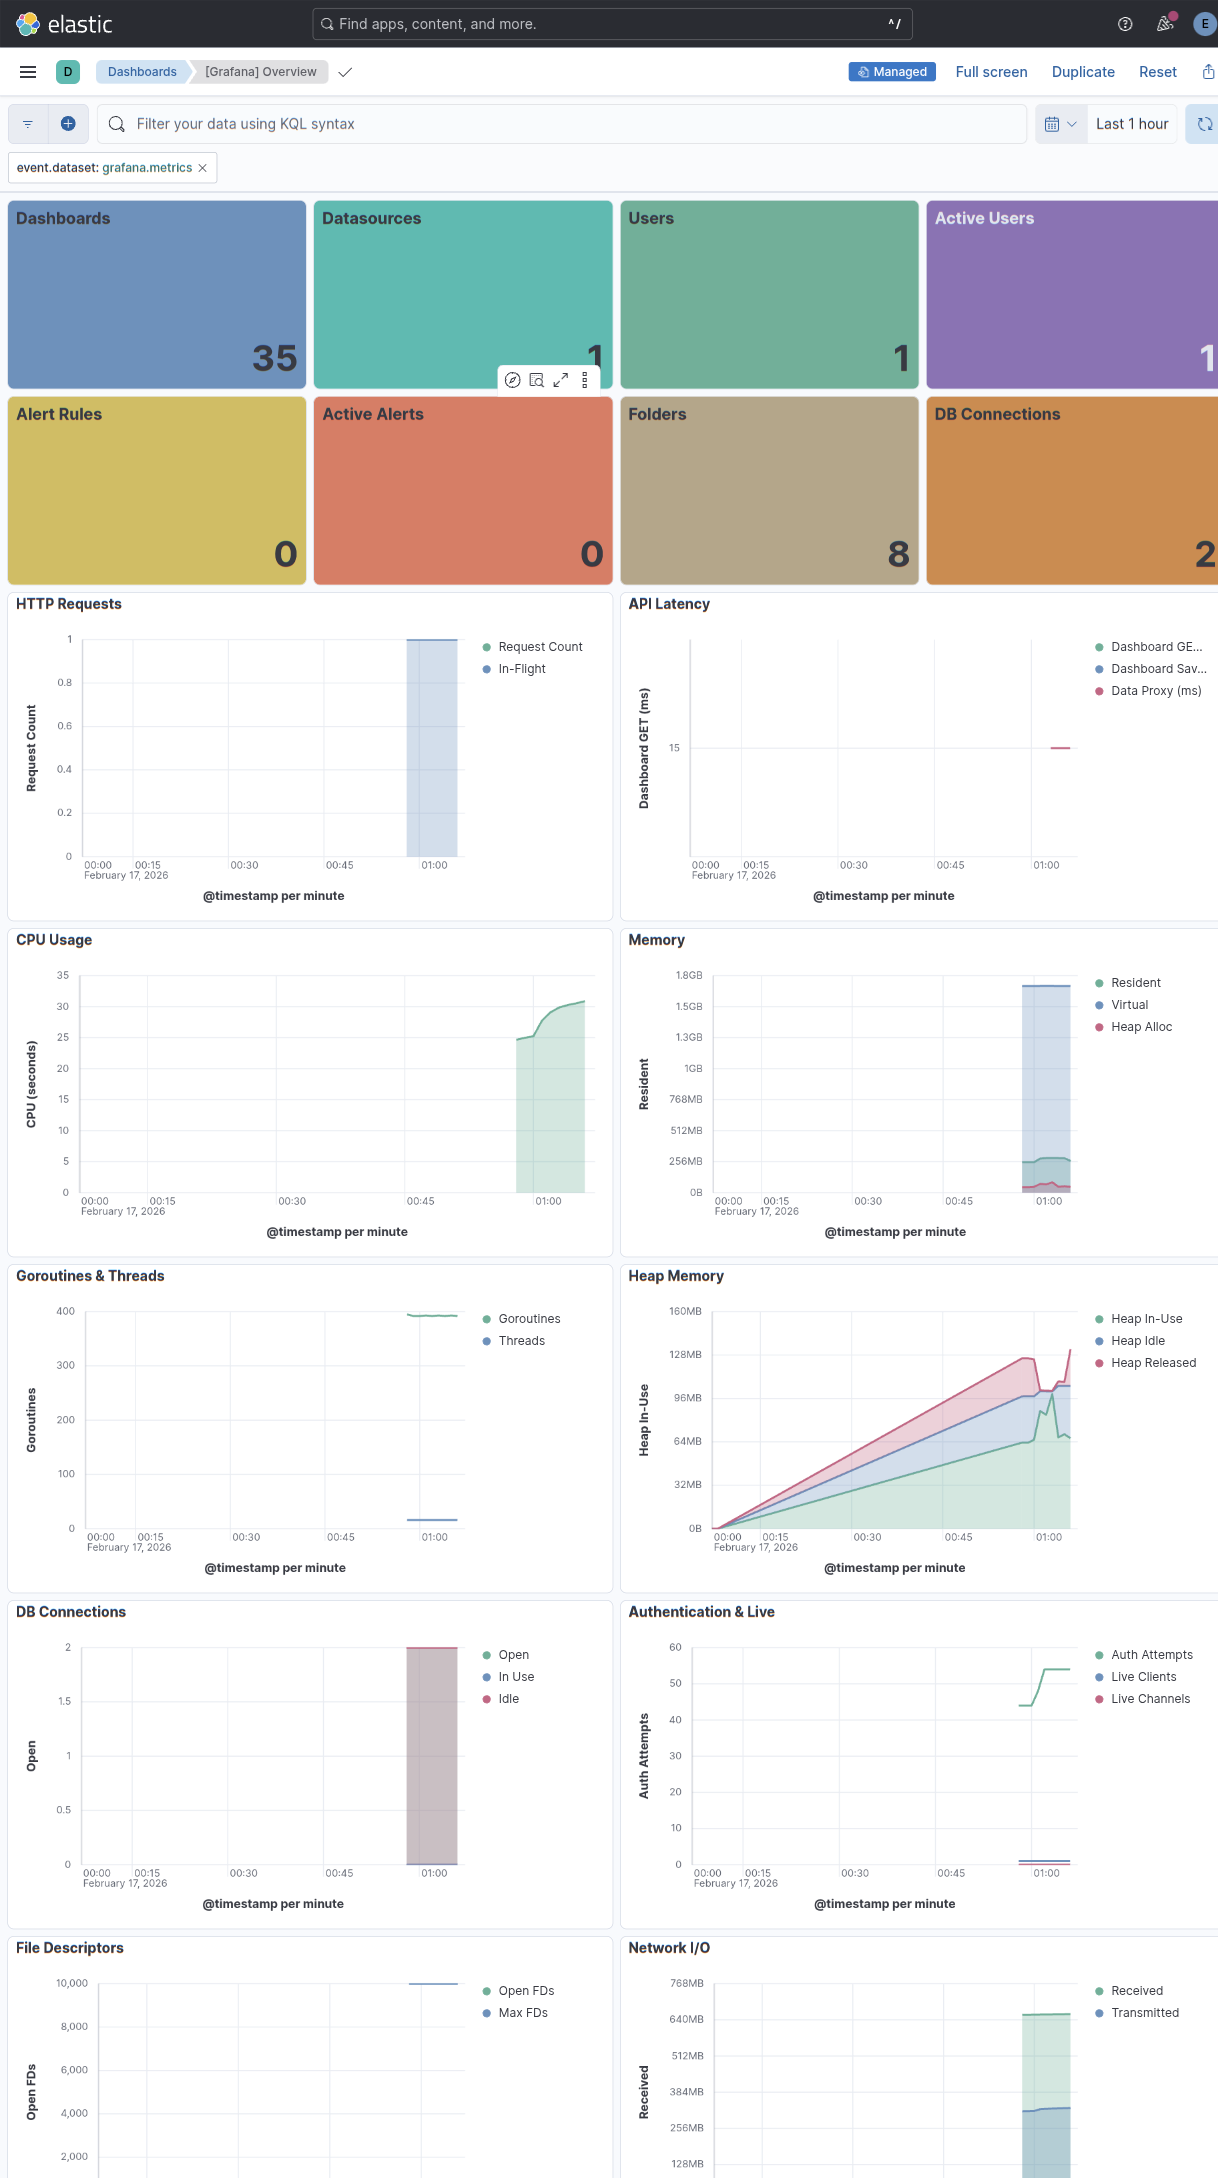
- **[Grafana] Overview** — Instance stats, CPU, memory, goroutines, file descriptors, database connections, and alerting status.
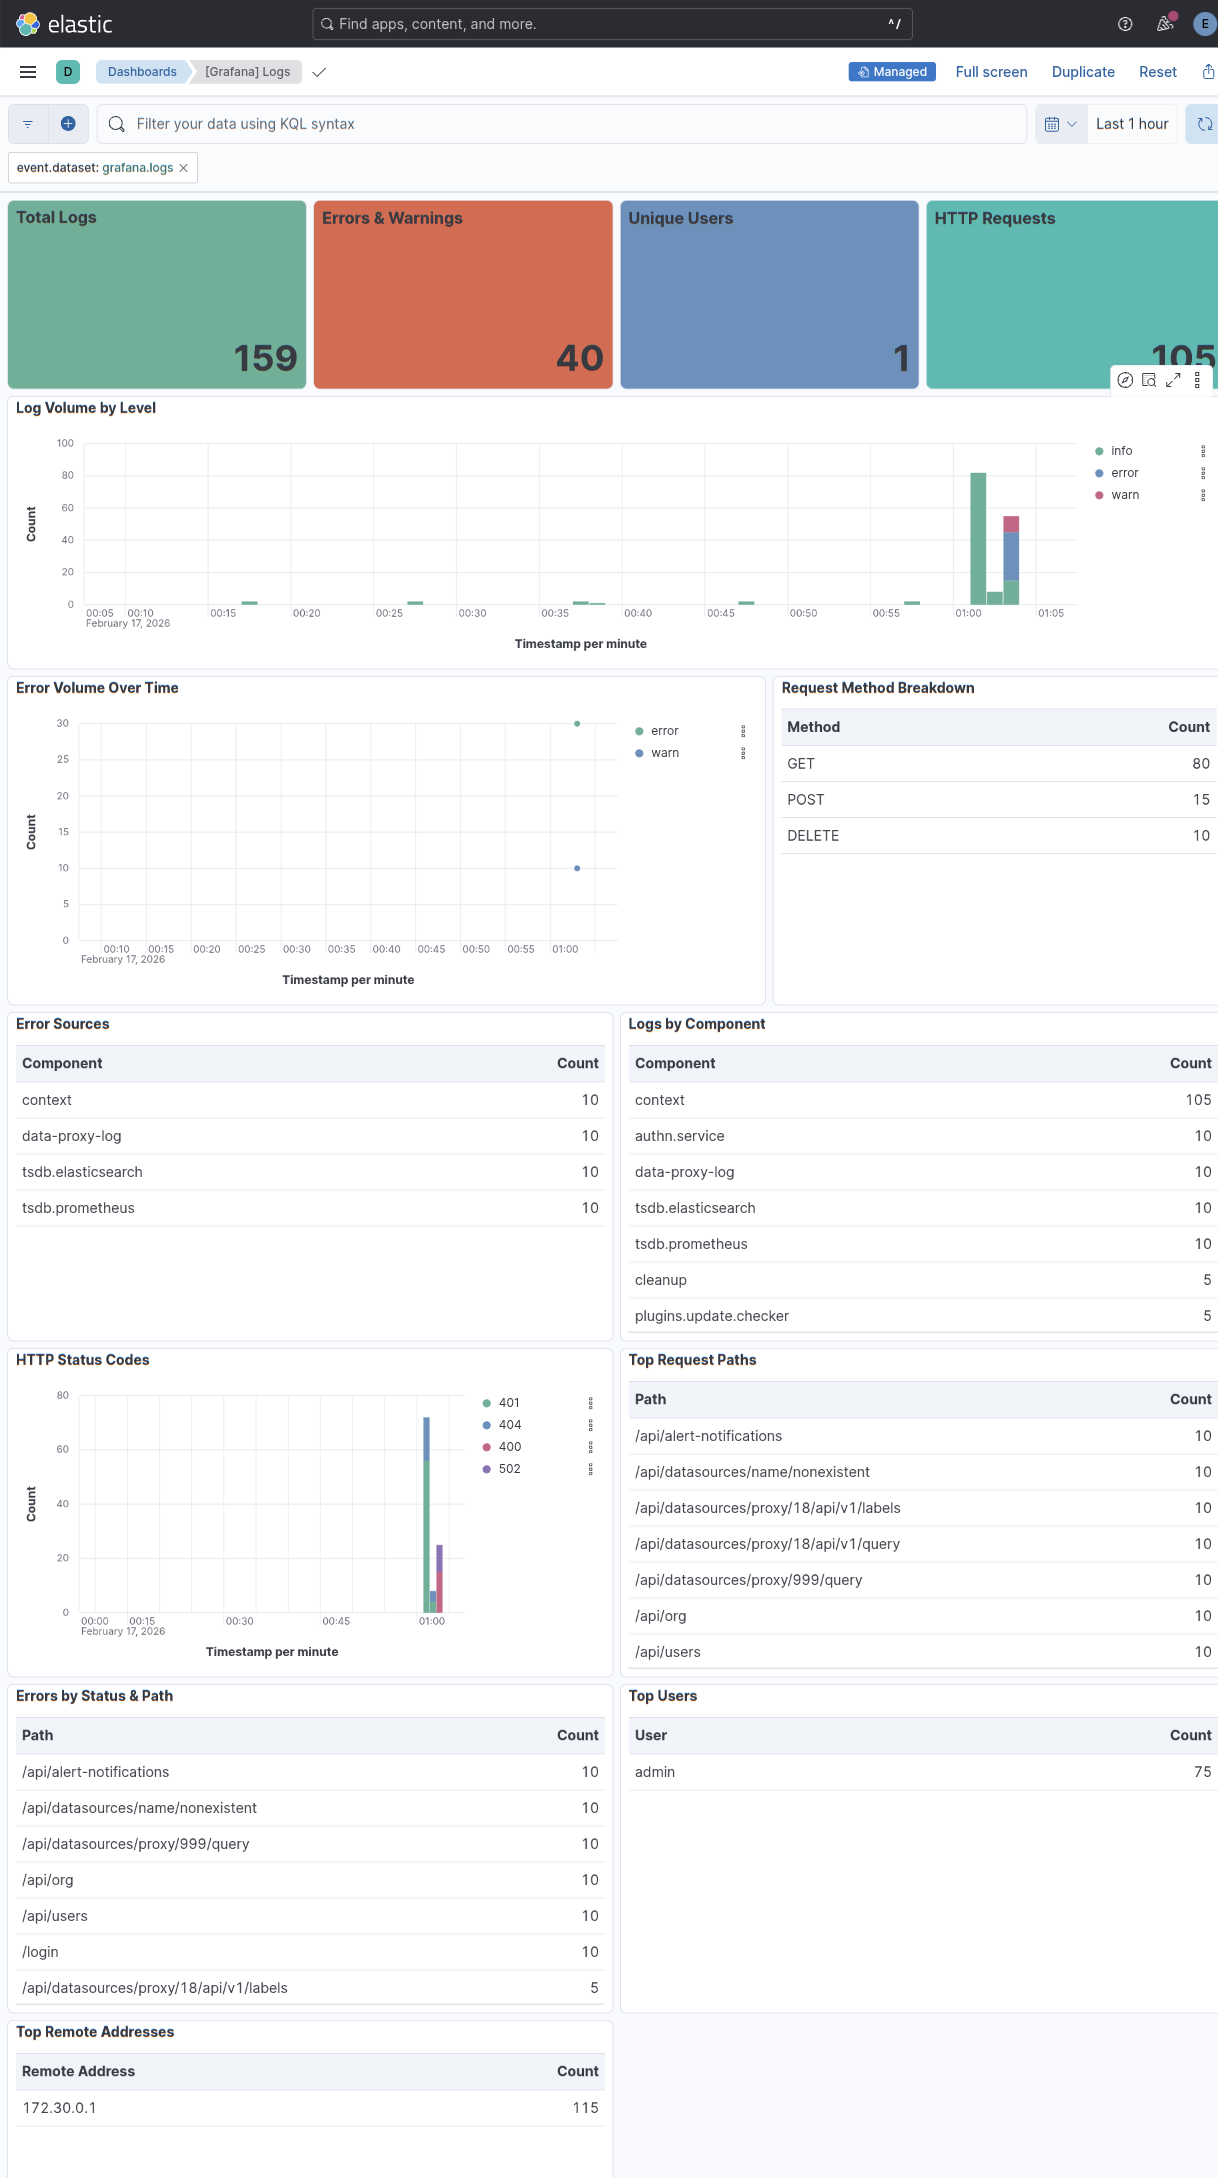
- **[Grafana] Logs** — Log volume by level, top error messages, component breakdown, HTTP status codes, and request paths.
## Screenshots
This integration includes one or more Kibana dashboards that visualizes the data collected by the integration. The screenshots below illustrate how the ingested data is displayed.
## Changelog
| Version | Details | Minimum Kibana version |
|-----------|----------------------------------------------------------------------------------------------------------------------------------------------|------------------------|
| **0.1.0** | **Enhancement** ([View pull request](https://github.com/elastic/integrations/pull/17433))Initial release with metrics and logs data streams. | 9.0.08.16.0 |