Palo Alto Prisma Access
Serverless Observability Serverless Security Stack
| Version | 1.6.1 (View all) |
| Subscription level What's this? |
Basic |
| Developed by What's this? |
Elastic |
| Ingestion method(s) | Network Protocol |
Palo Alto Prisma Access is a Secure Access Service Edge (SASE) platform that enables organizations to provide protected connectivity to their network and applications for branches, retail locations, and remote users. It's designed to ensure secure access to the cloud, SaaS, and internet for users, regardless of their location. Prisma Access uses a cloud-delivered infrastructure to connect users to applications, delivering both network security and a seamless user experience.
Use the Palo Alto Prisma Access integration to collect and parse data from the Syslog server. Then visualize that data in Kibana.
This module has been tested against the latest Palo Alto Prisma Access version 5.0.
The Palo Alto Prisma Access integration collects 16 types of event types:
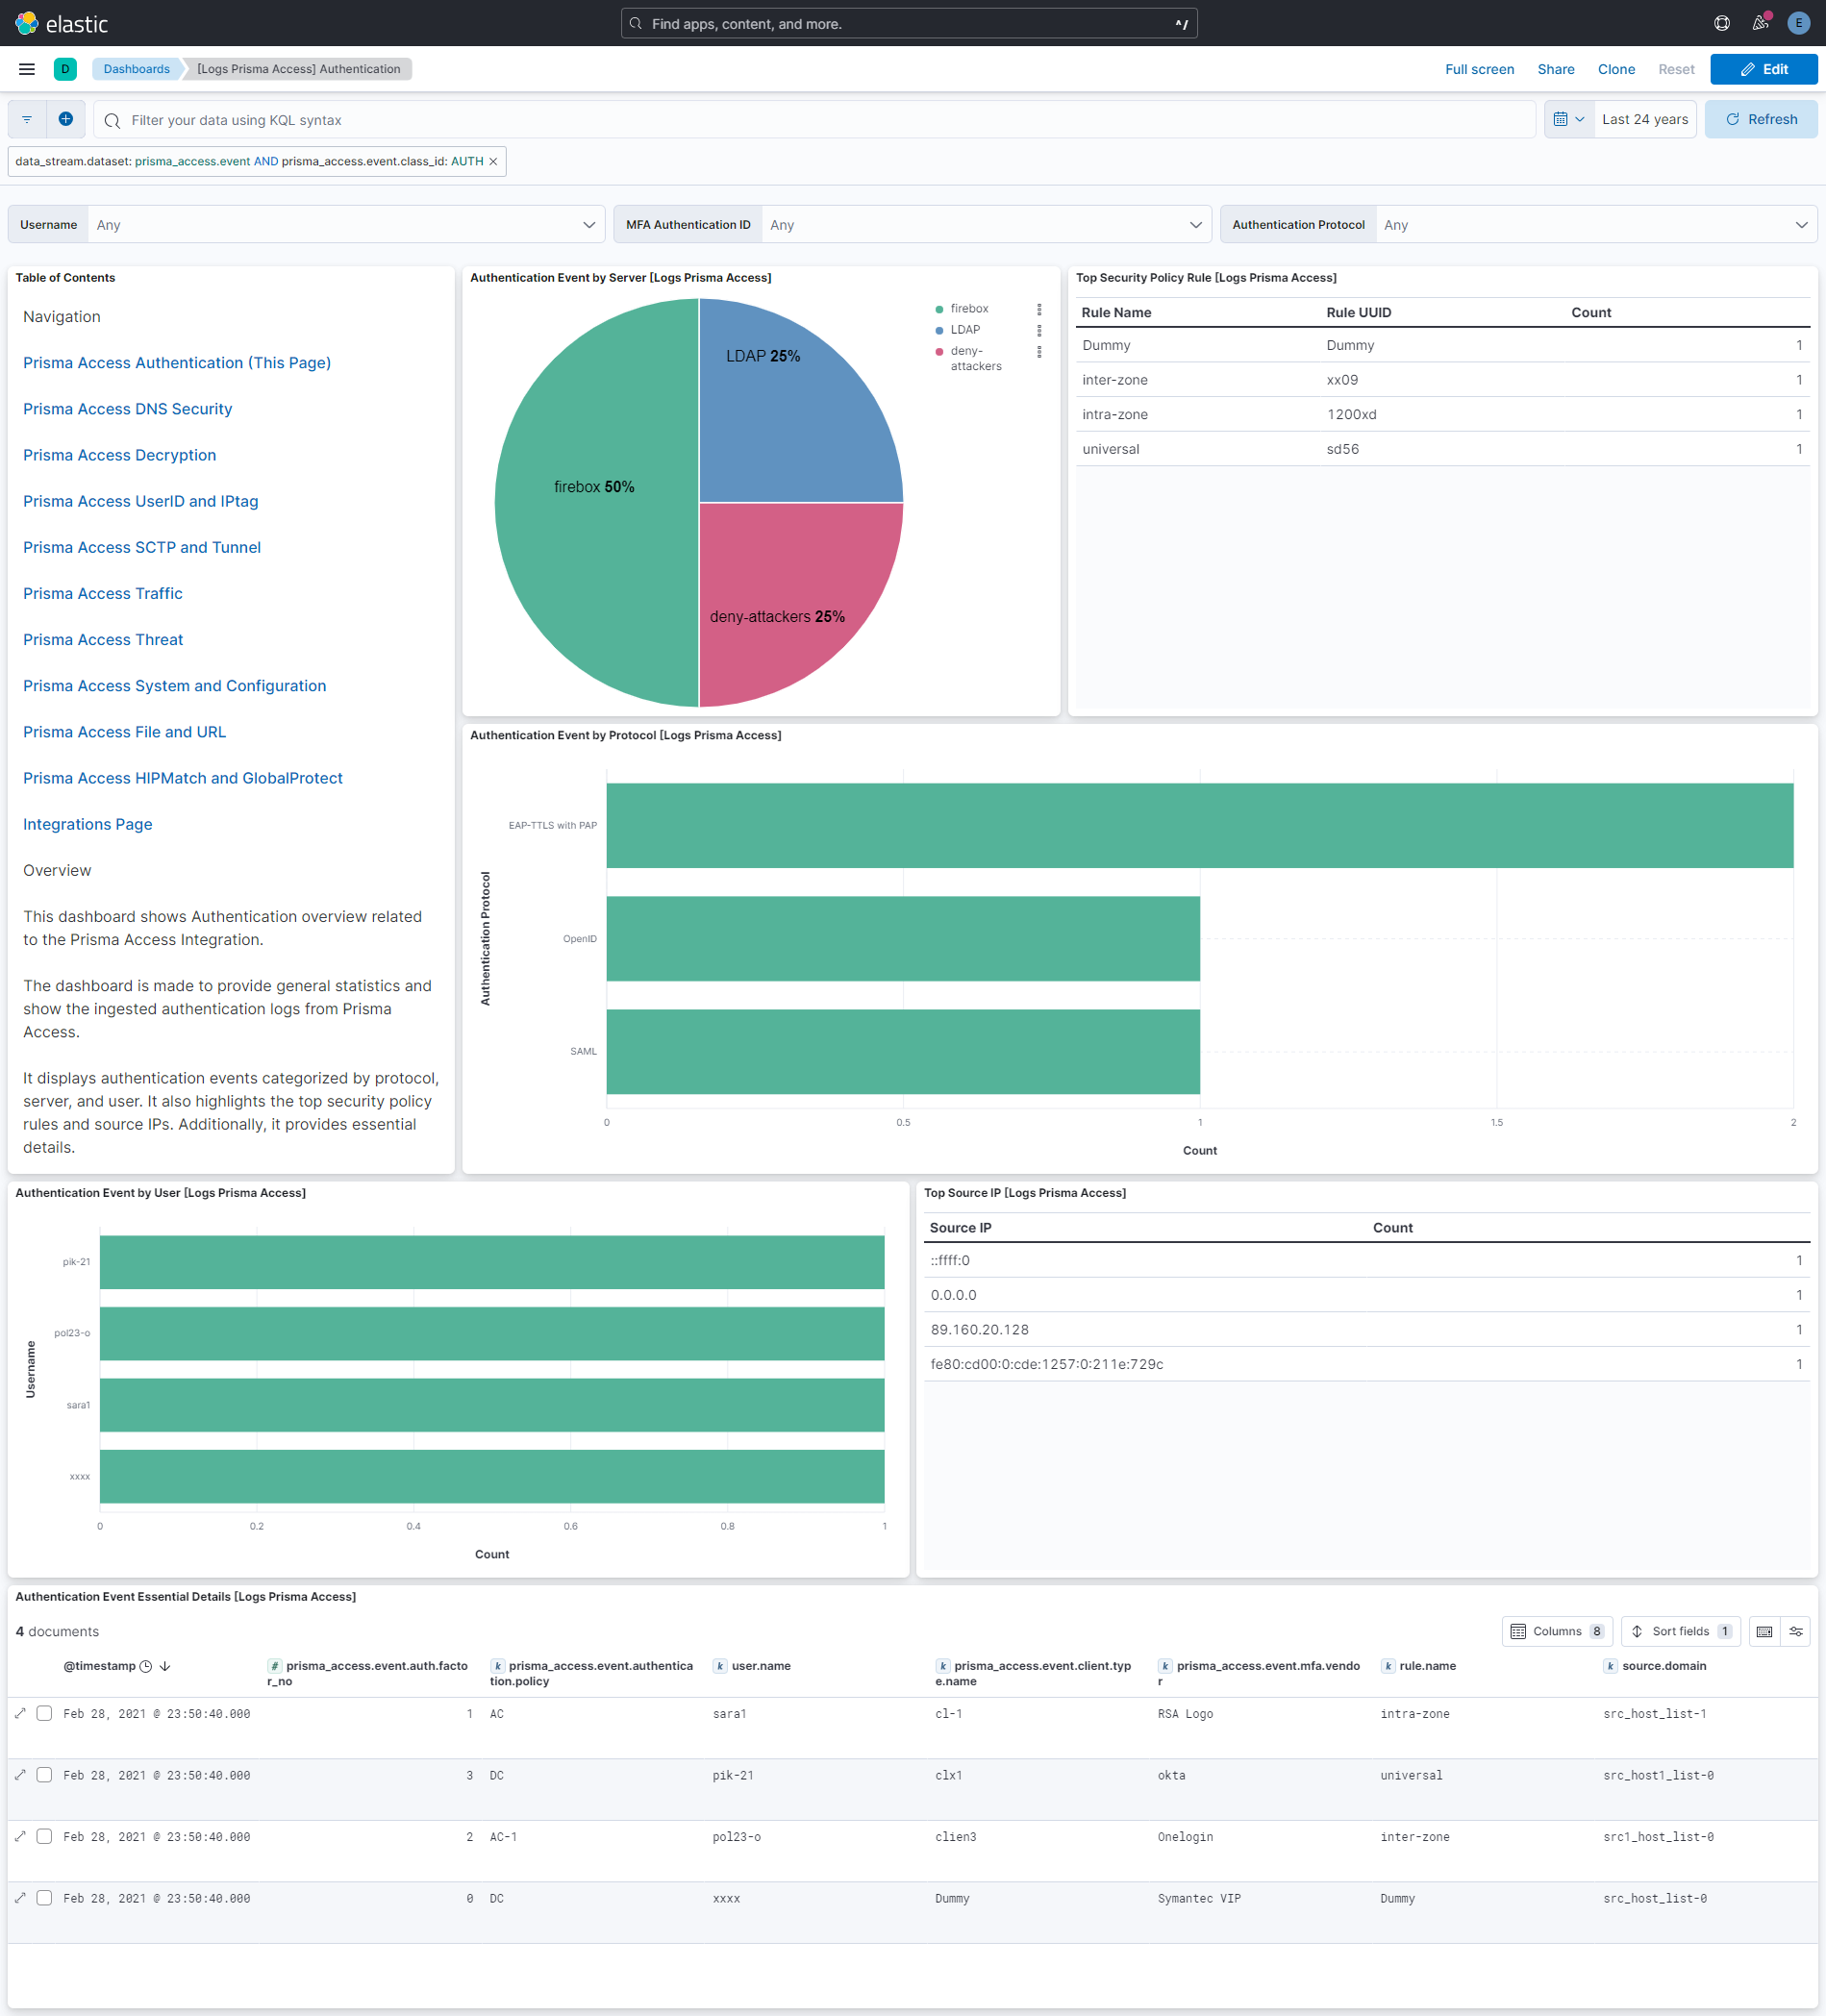
Authentication - Auth logs contain information about authentication events seen by the next-generation firewall.
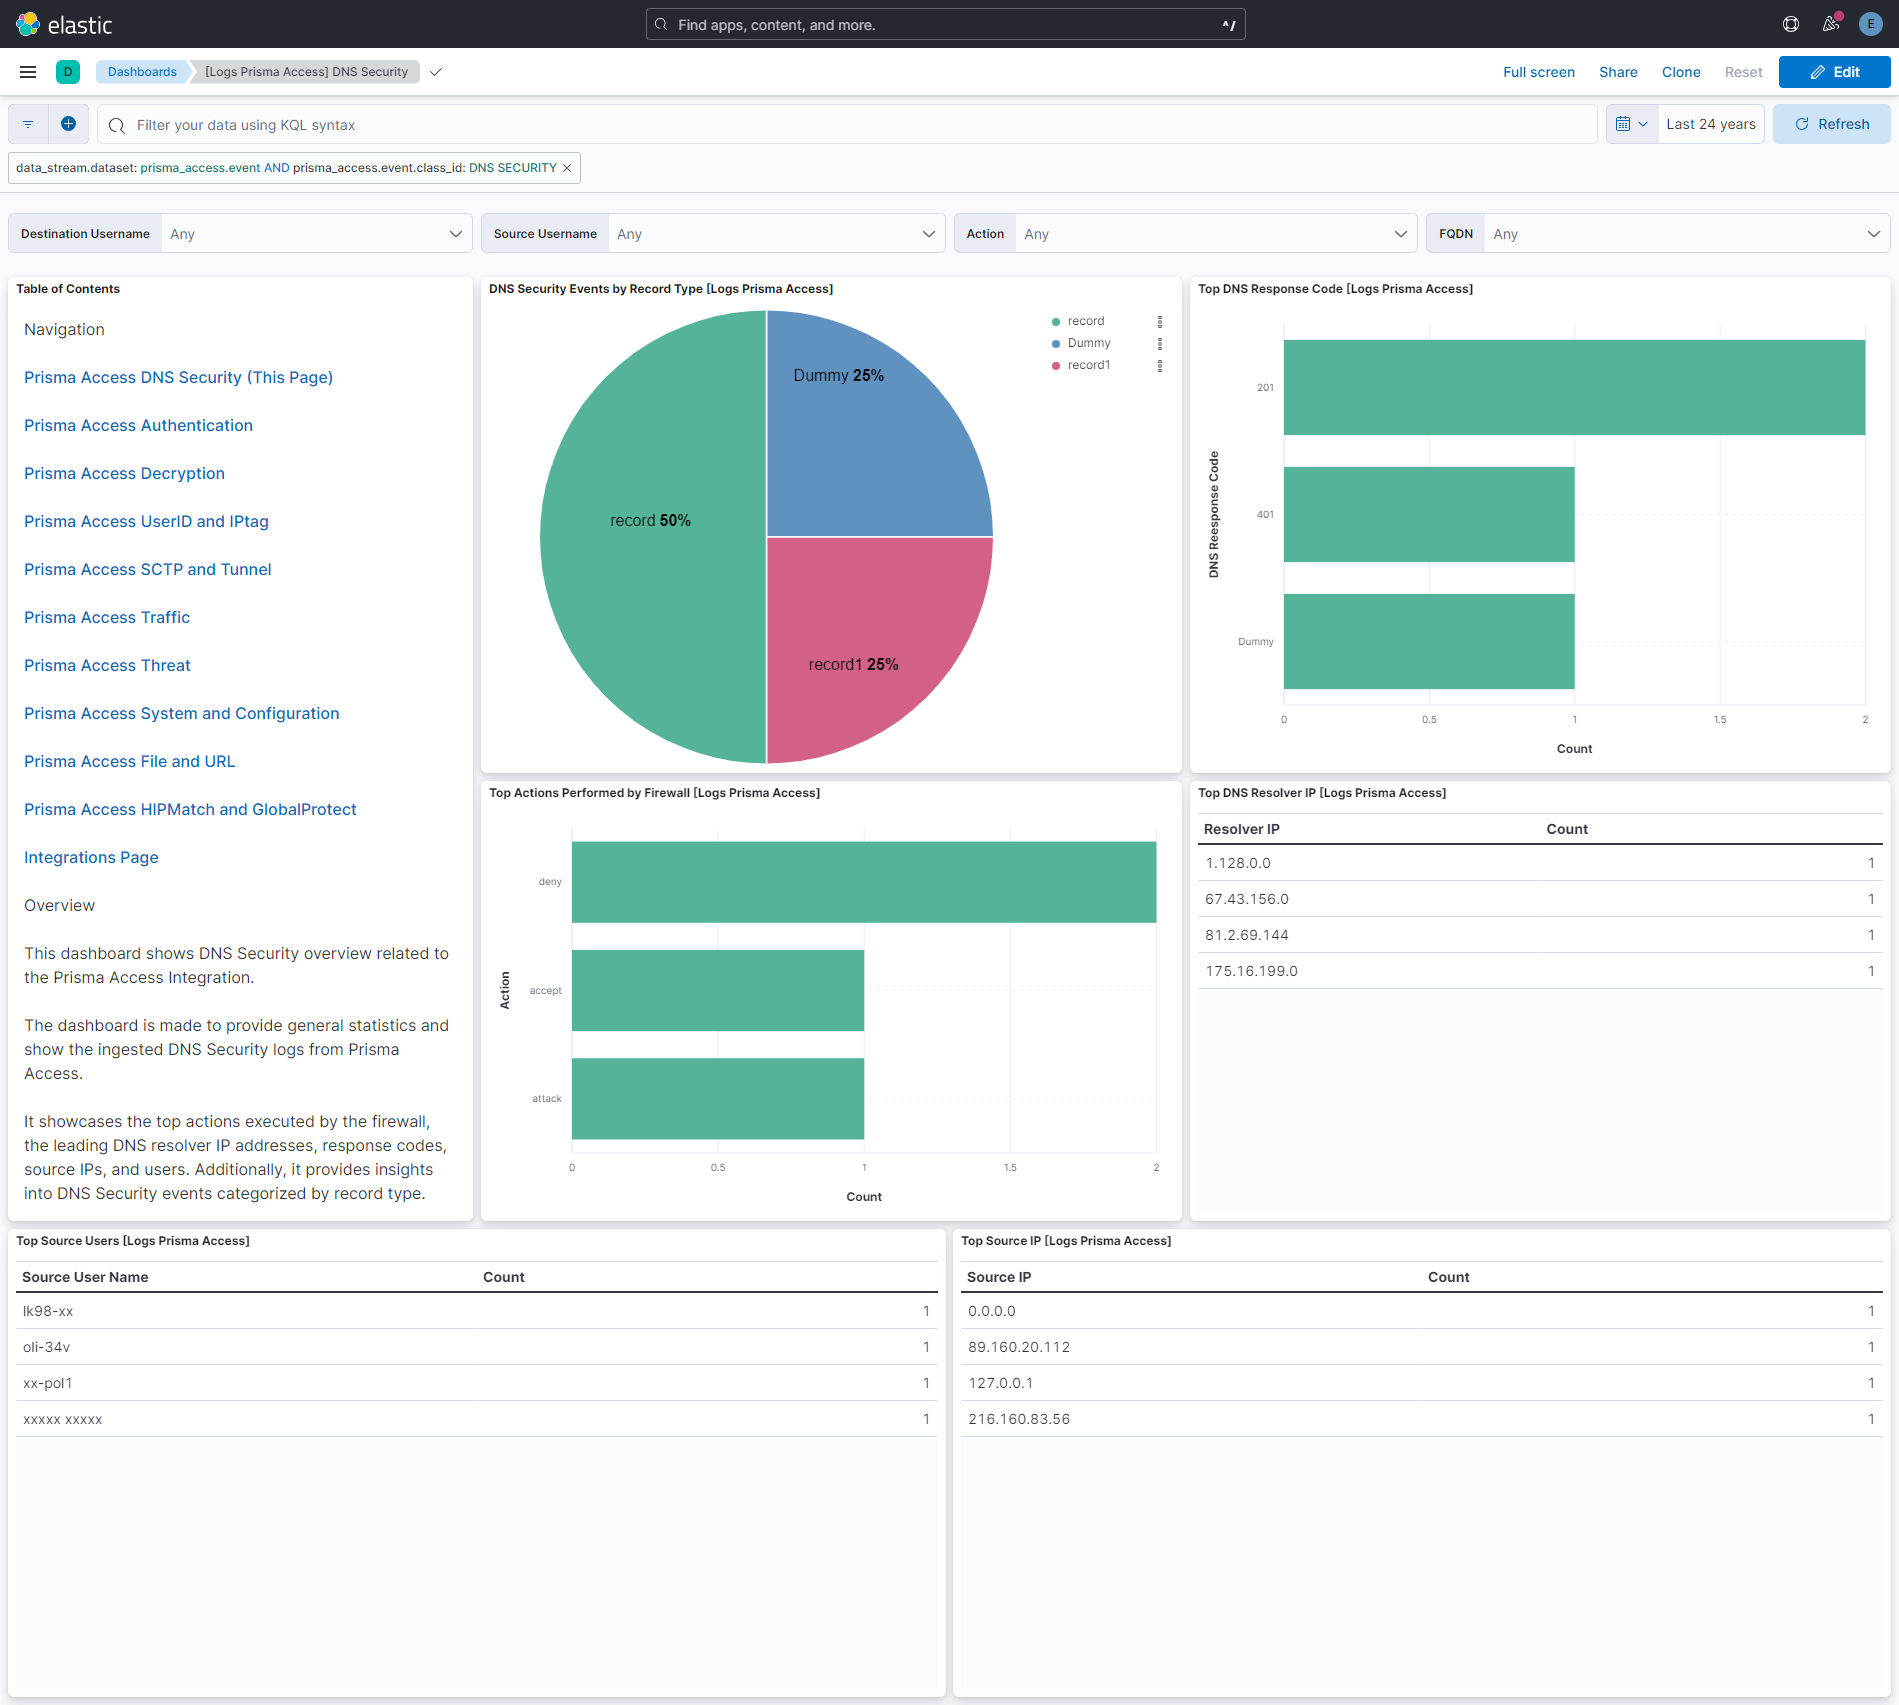
DNS Security - DNS Security logs contain information that the DNS Security service collects, such as server response and request information based on your firewall security policy rules, associated action, and the DNS query details when performing domain lookups.
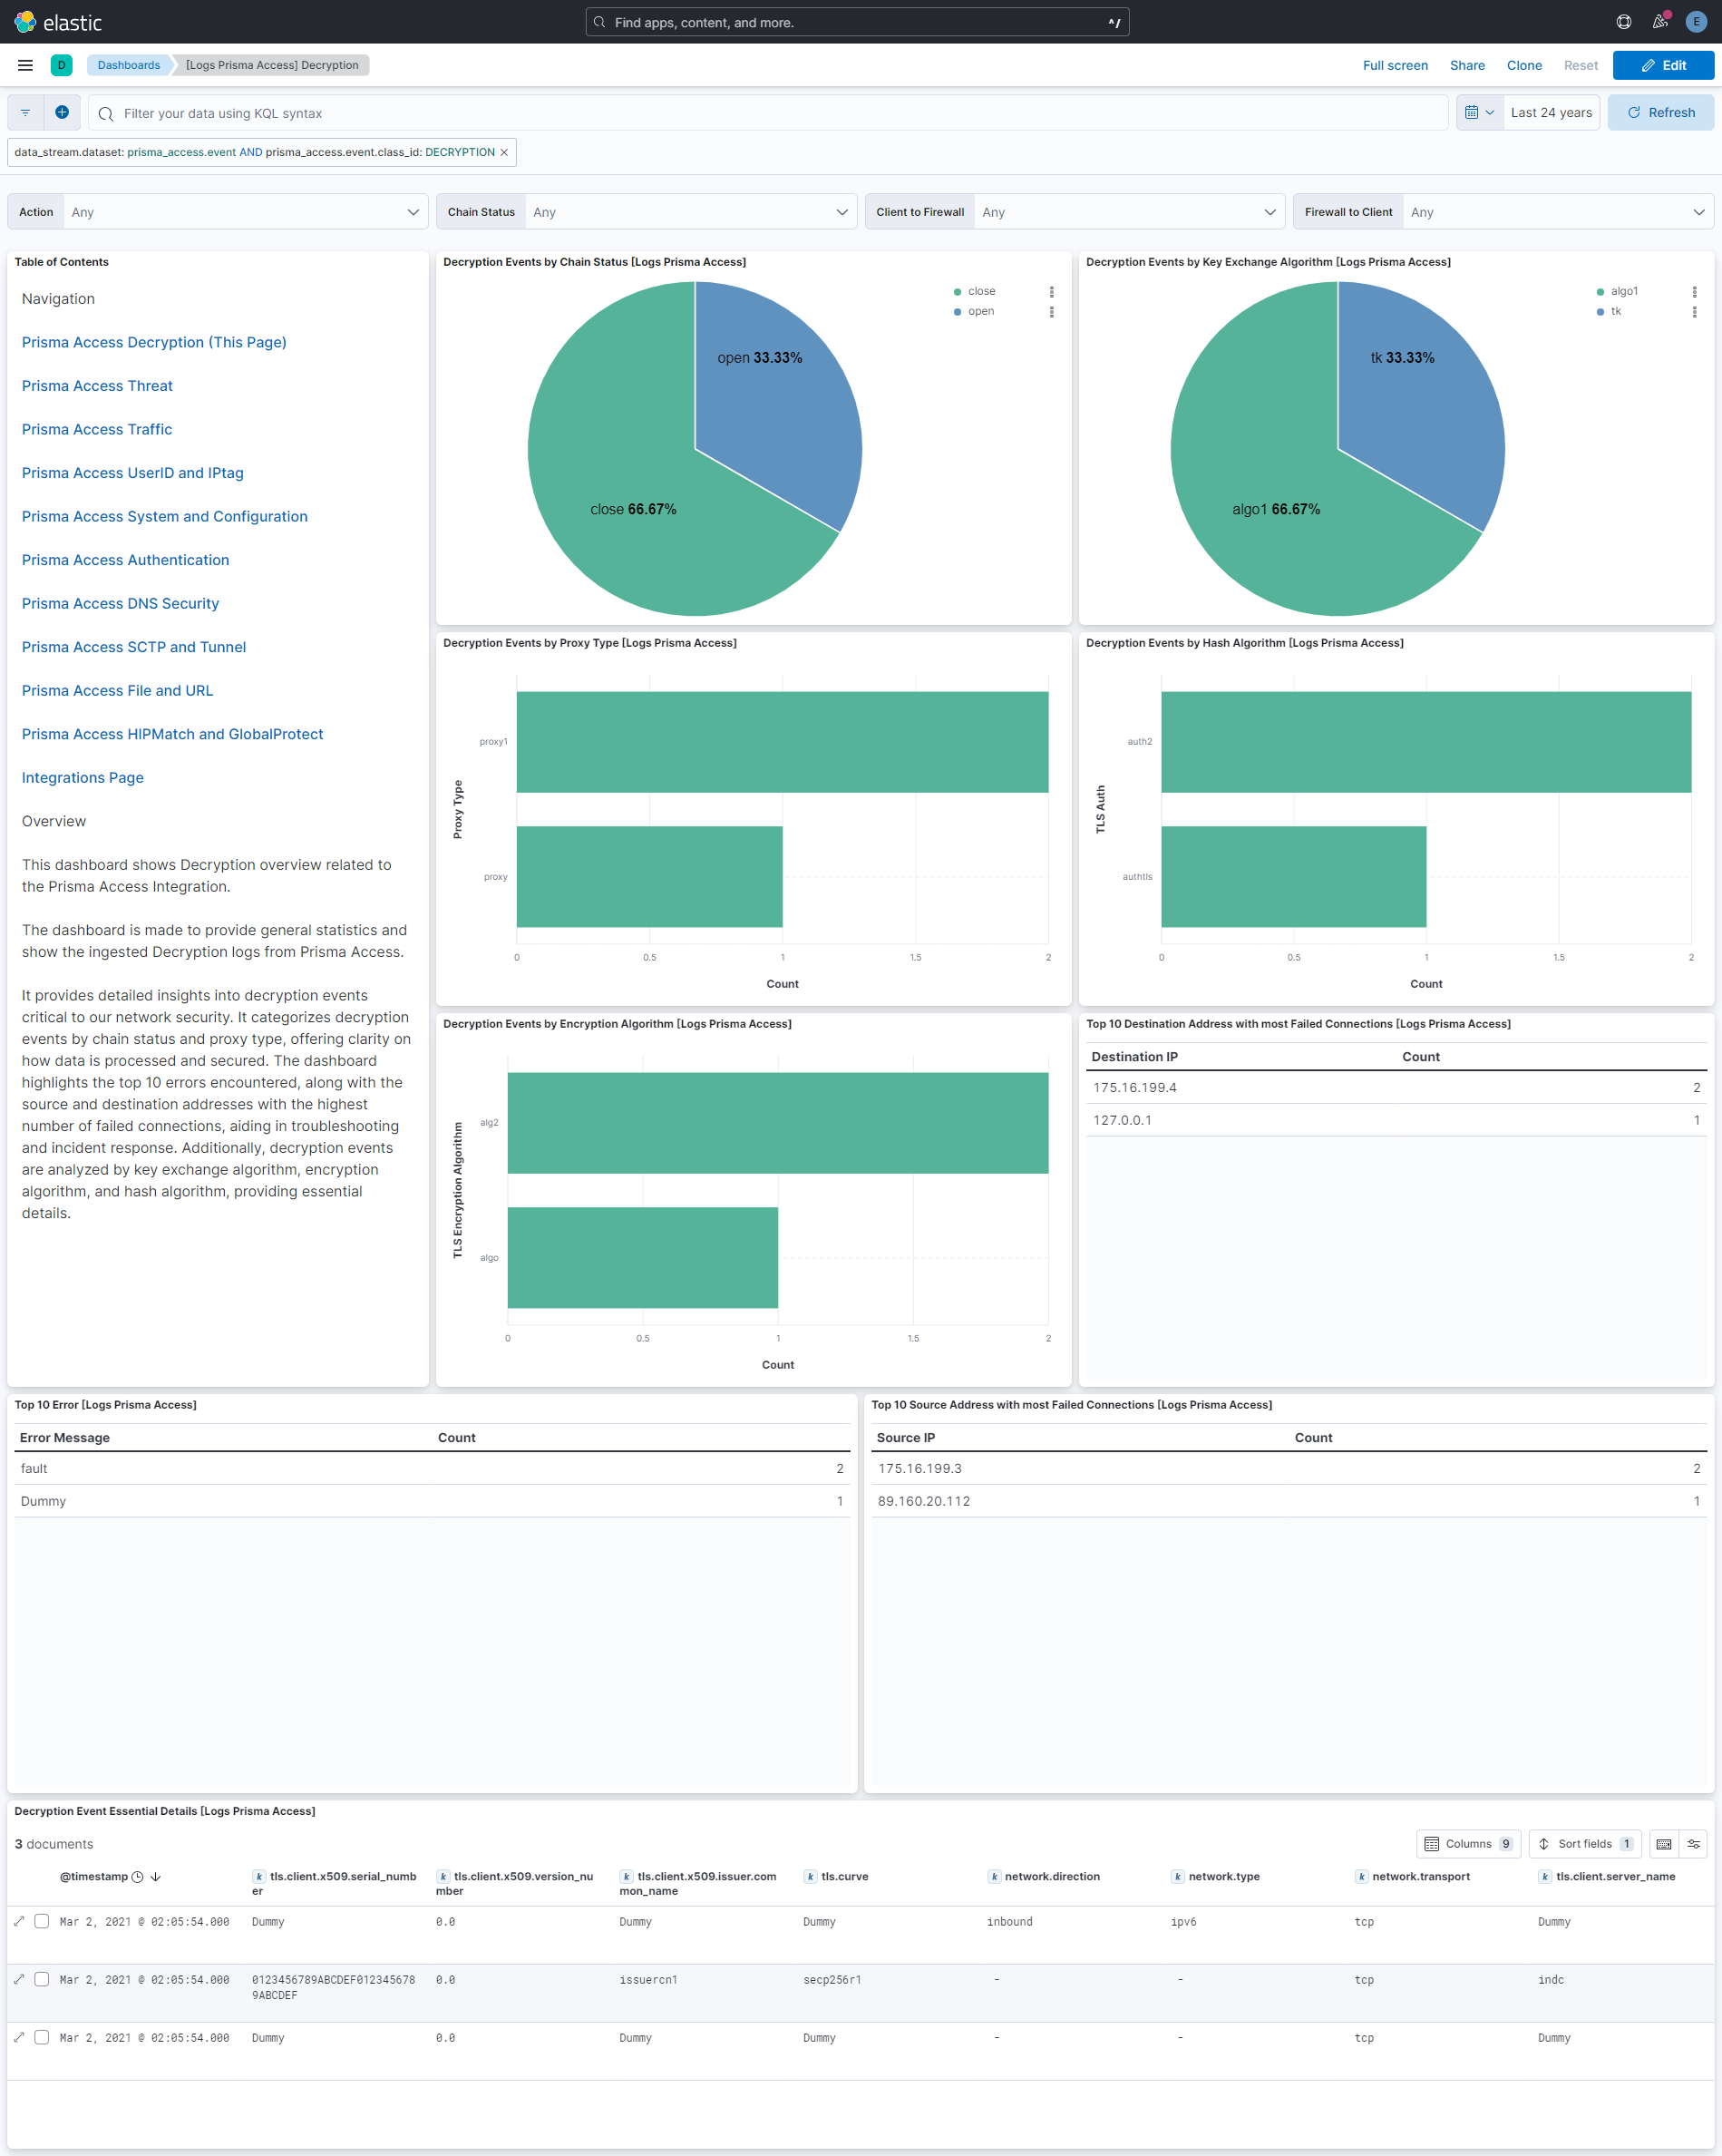
Decryption - By default, decryption logs display entries for unsuccessful TLS handshakes.
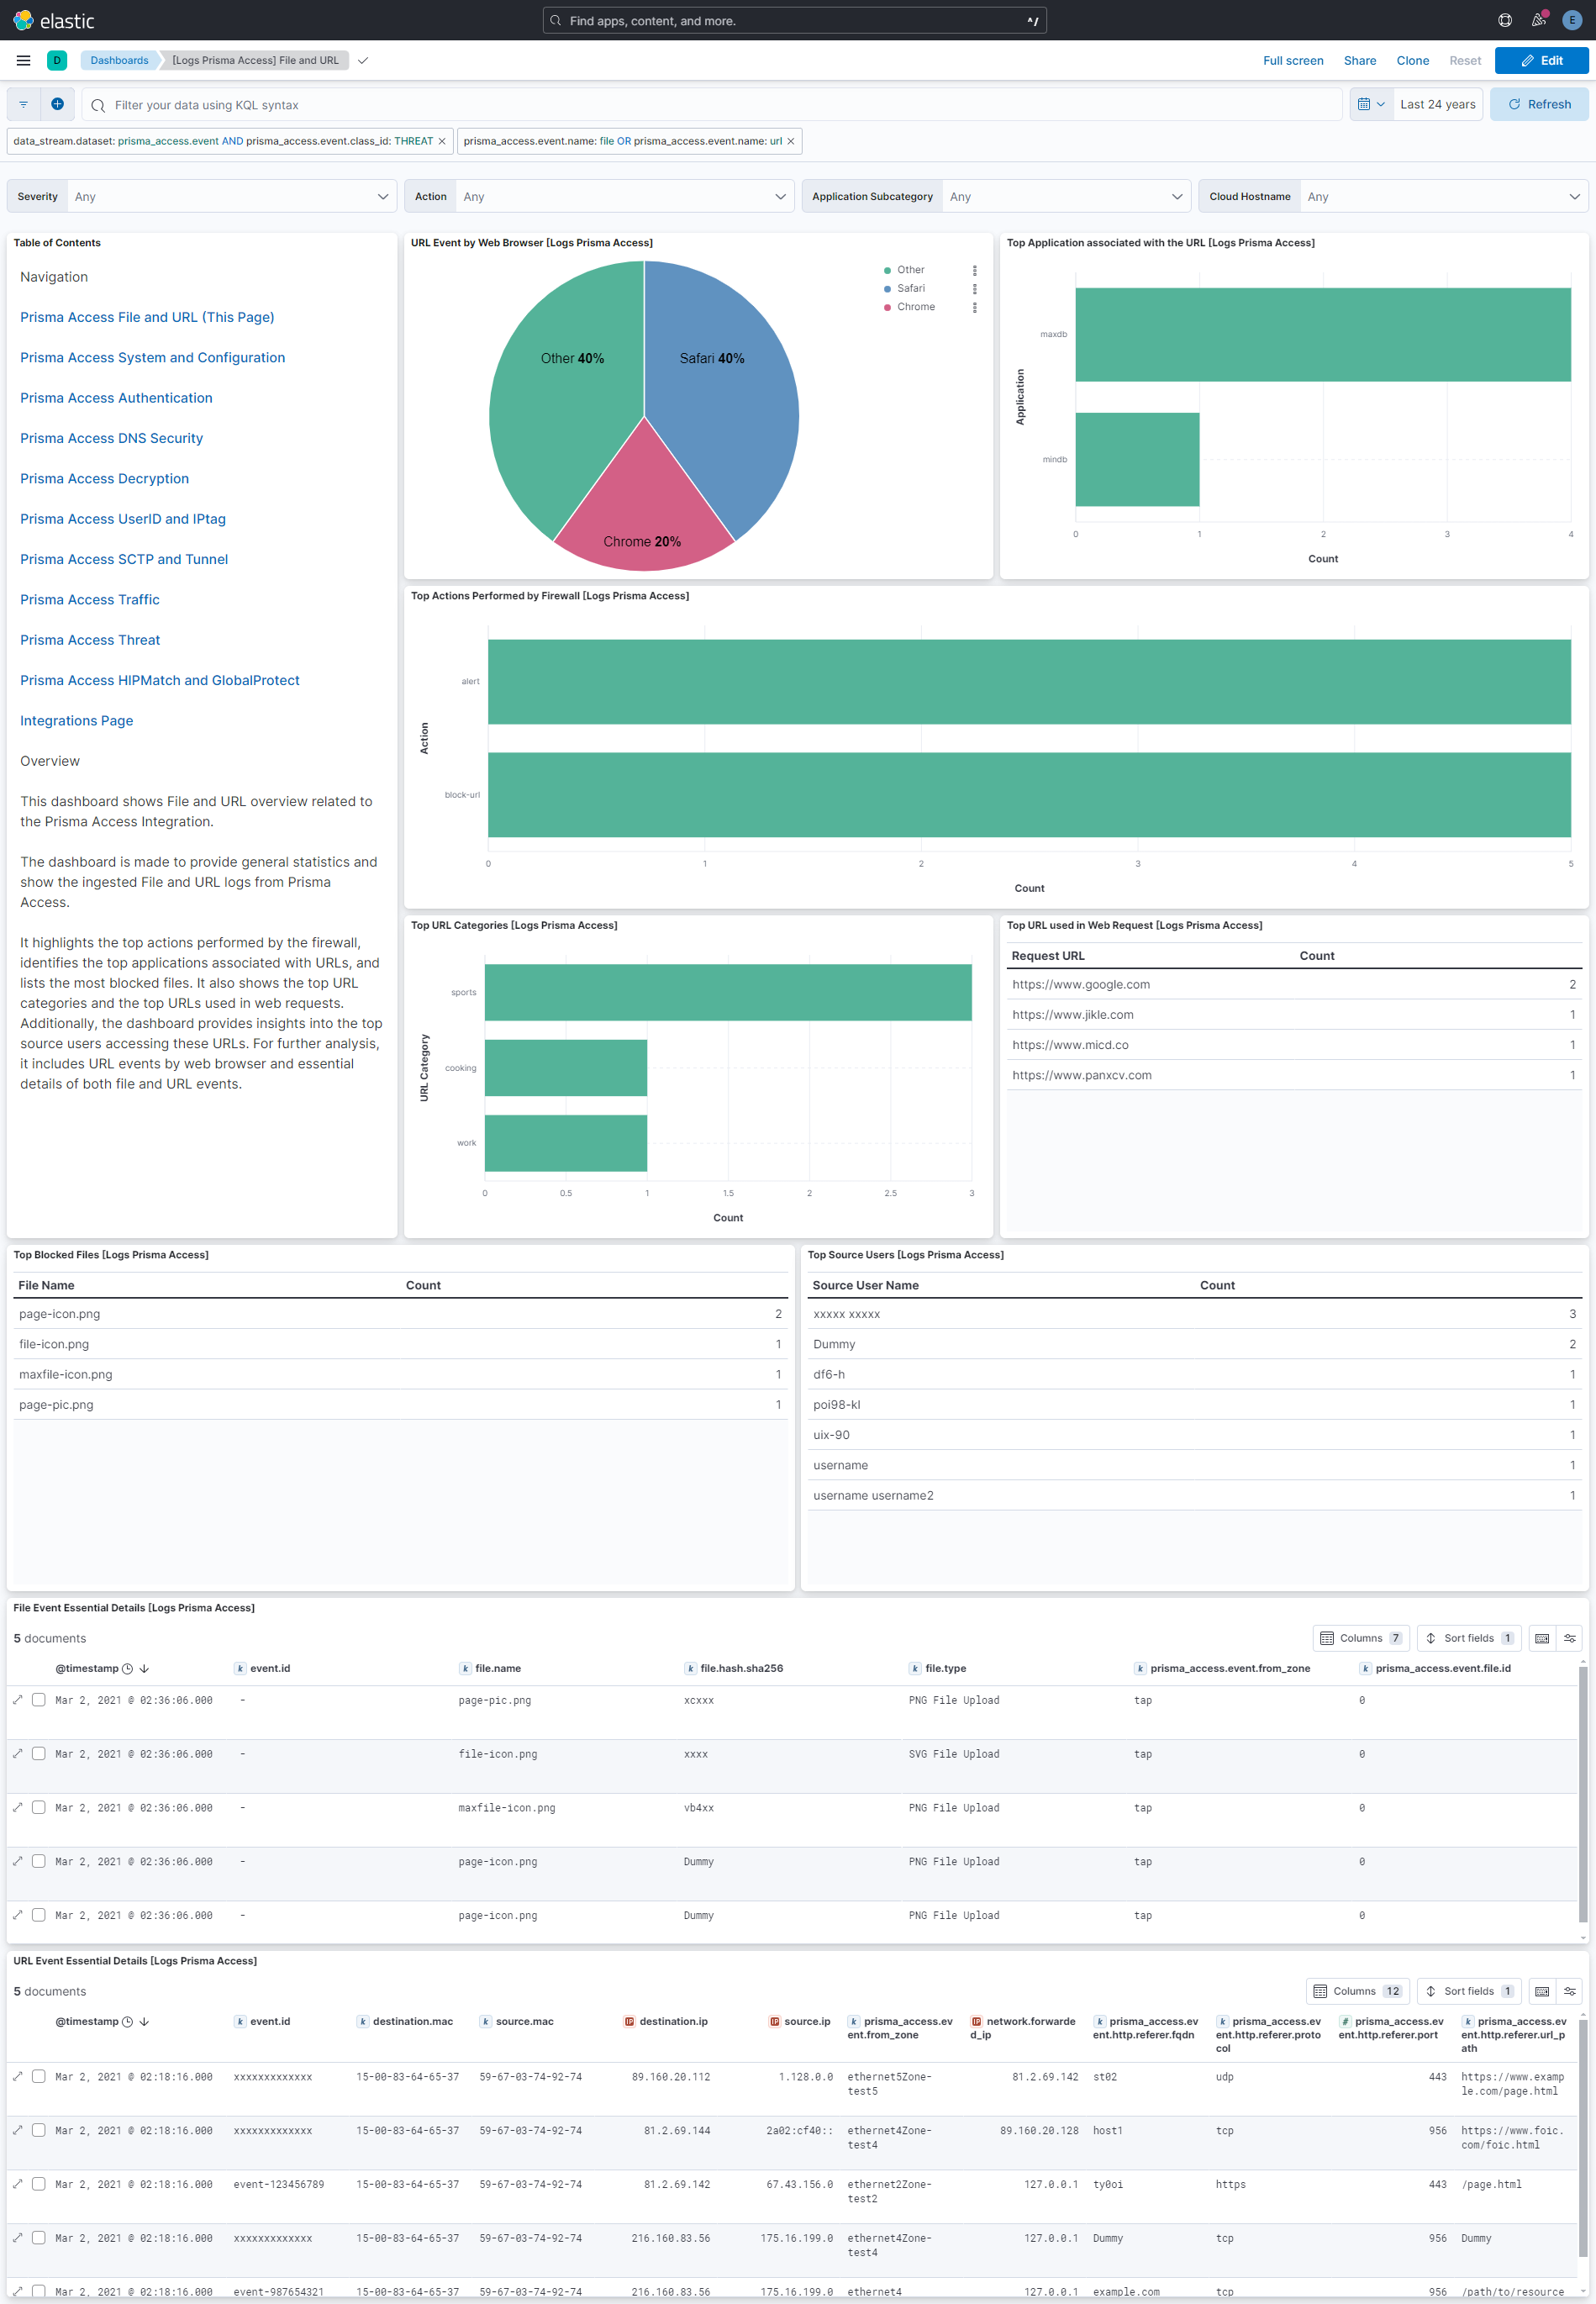
File - File logs represents a file transfer across the network.
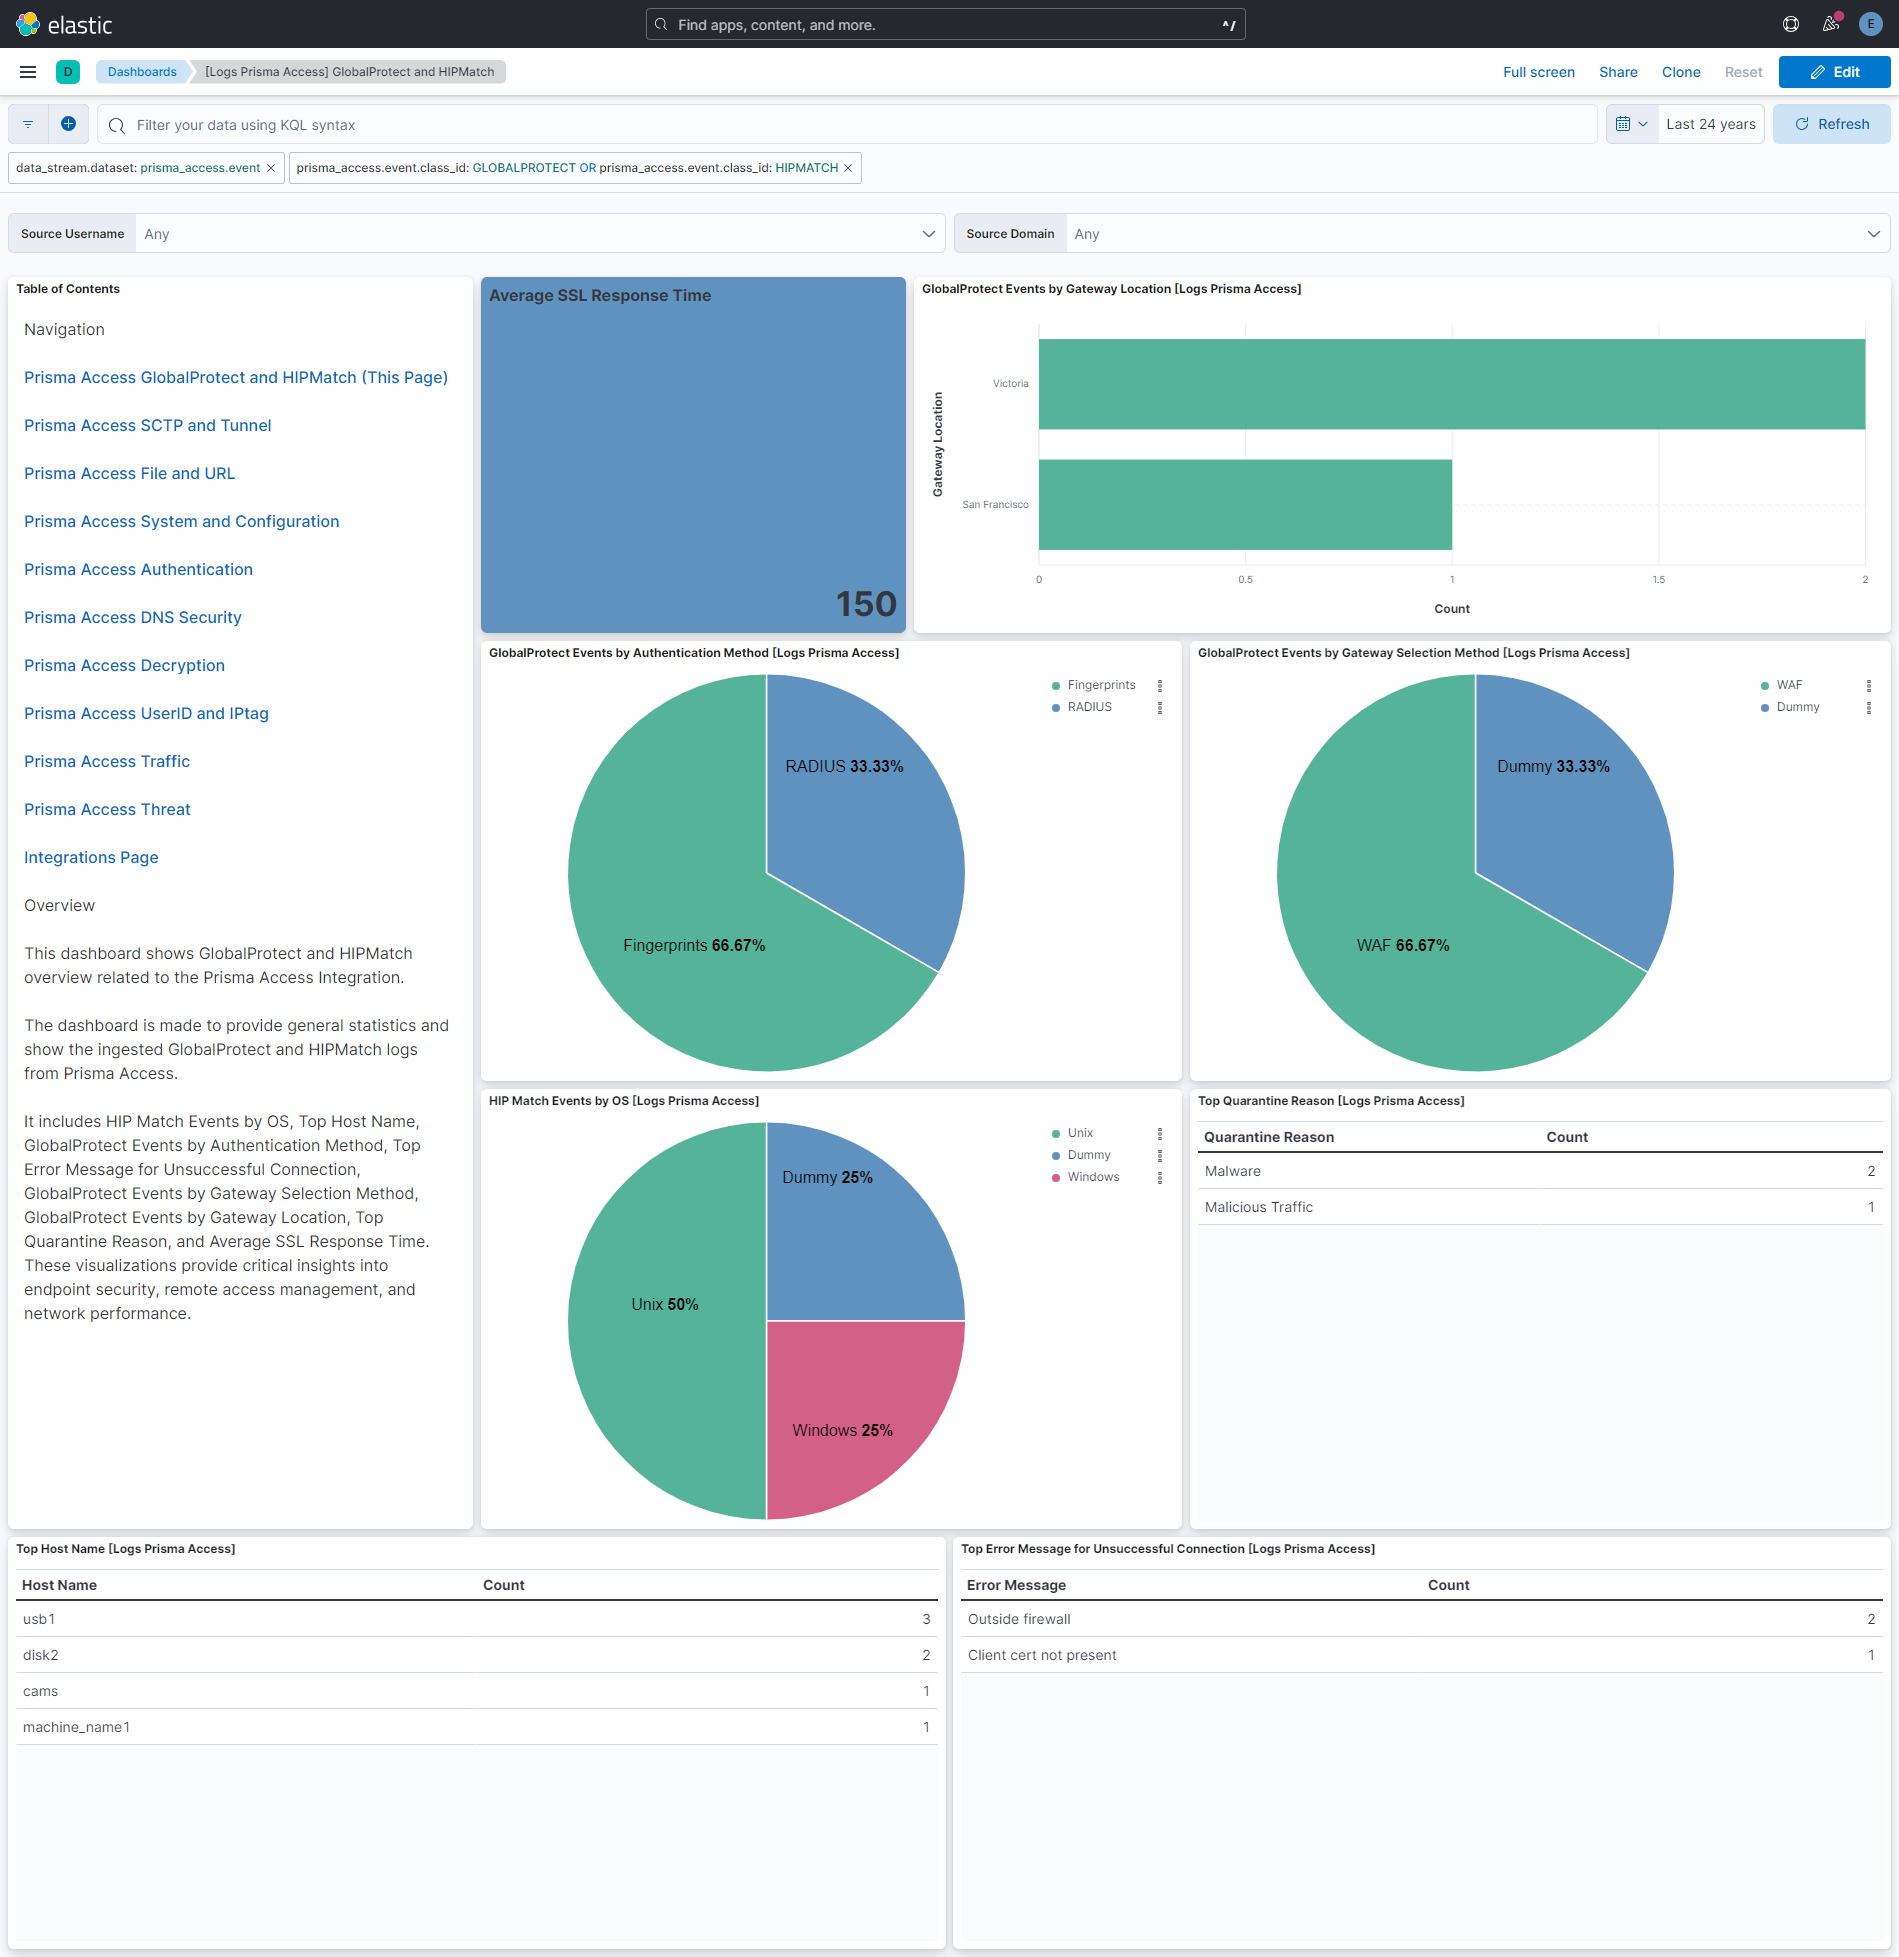
GlobalProtect - GlobalProtect logs identify network traffic between a GlobalProtect portal or gateway, and GlobalProtect apps.
HIP Match - HIP Match logs capture information about the security status of the endpoints accessing a network (such as whether they have disk encryption enabled).
IPtag - IPtag logs display how and when a source IP address is registered or unregistered with the next-generation firewall, and what tag the firewall applied to the address.
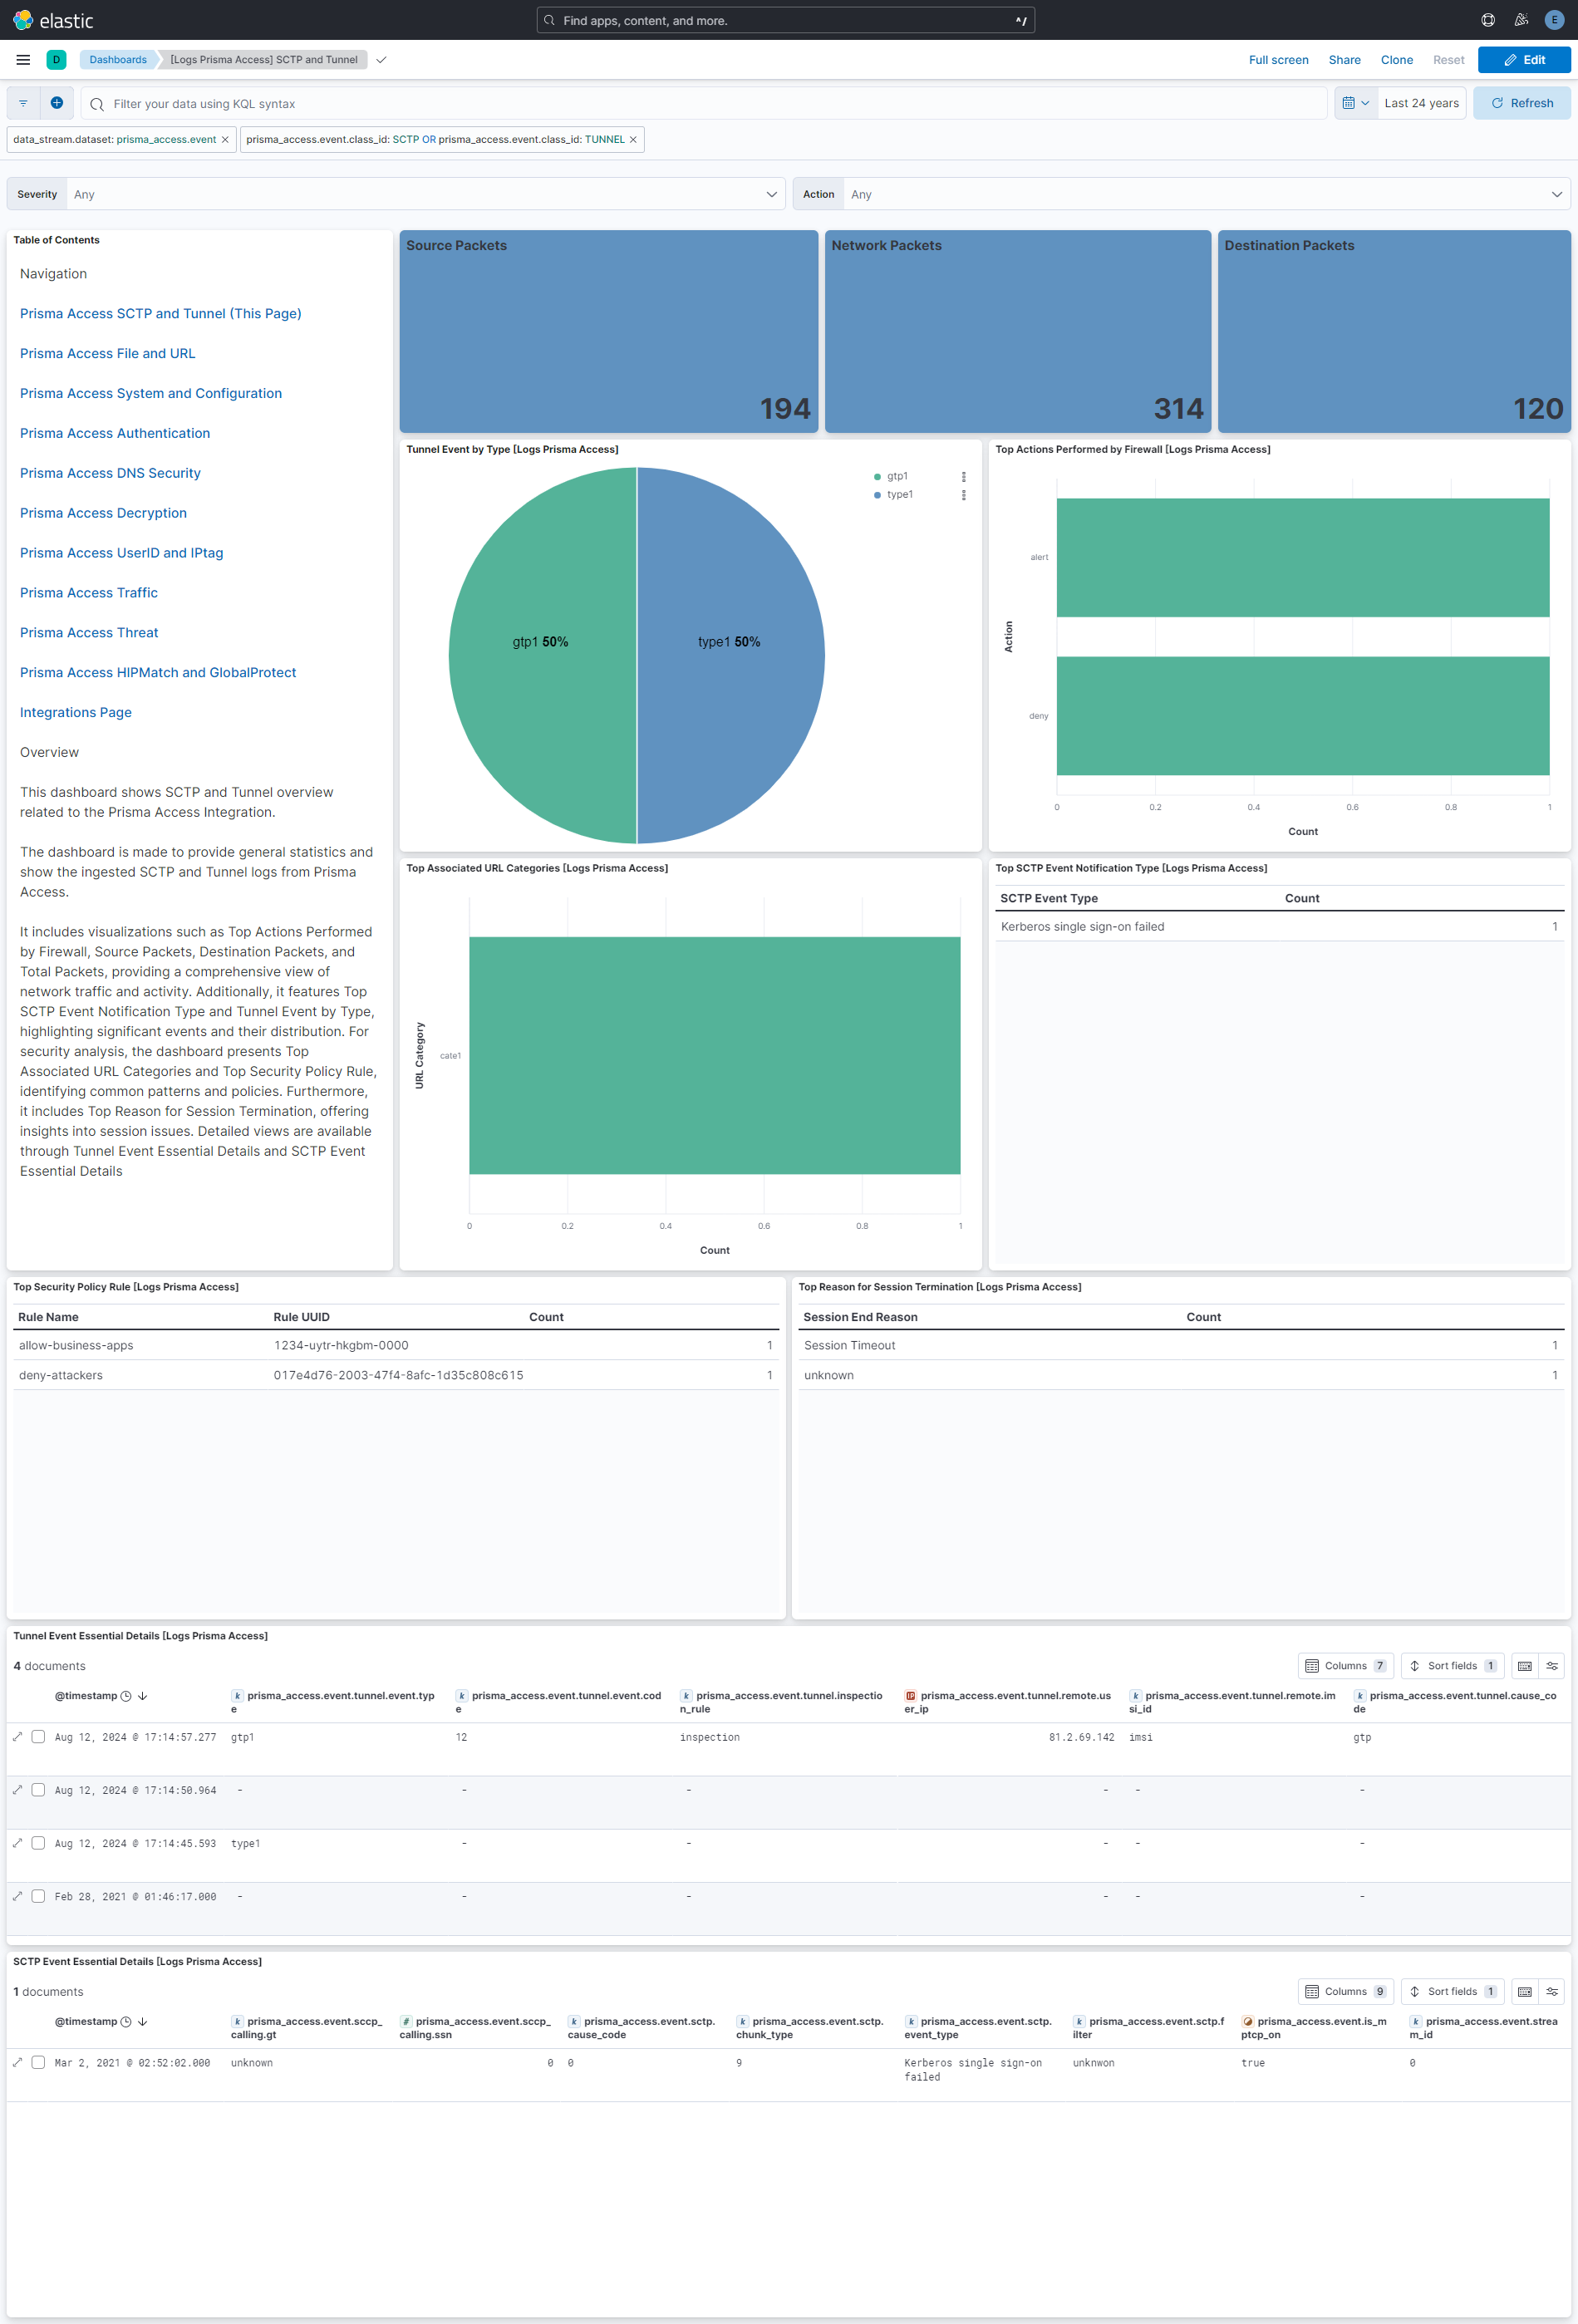
SCTP - SCTP logs are written at the end of every SCTP network session, as well as optionally at the start of every such session.
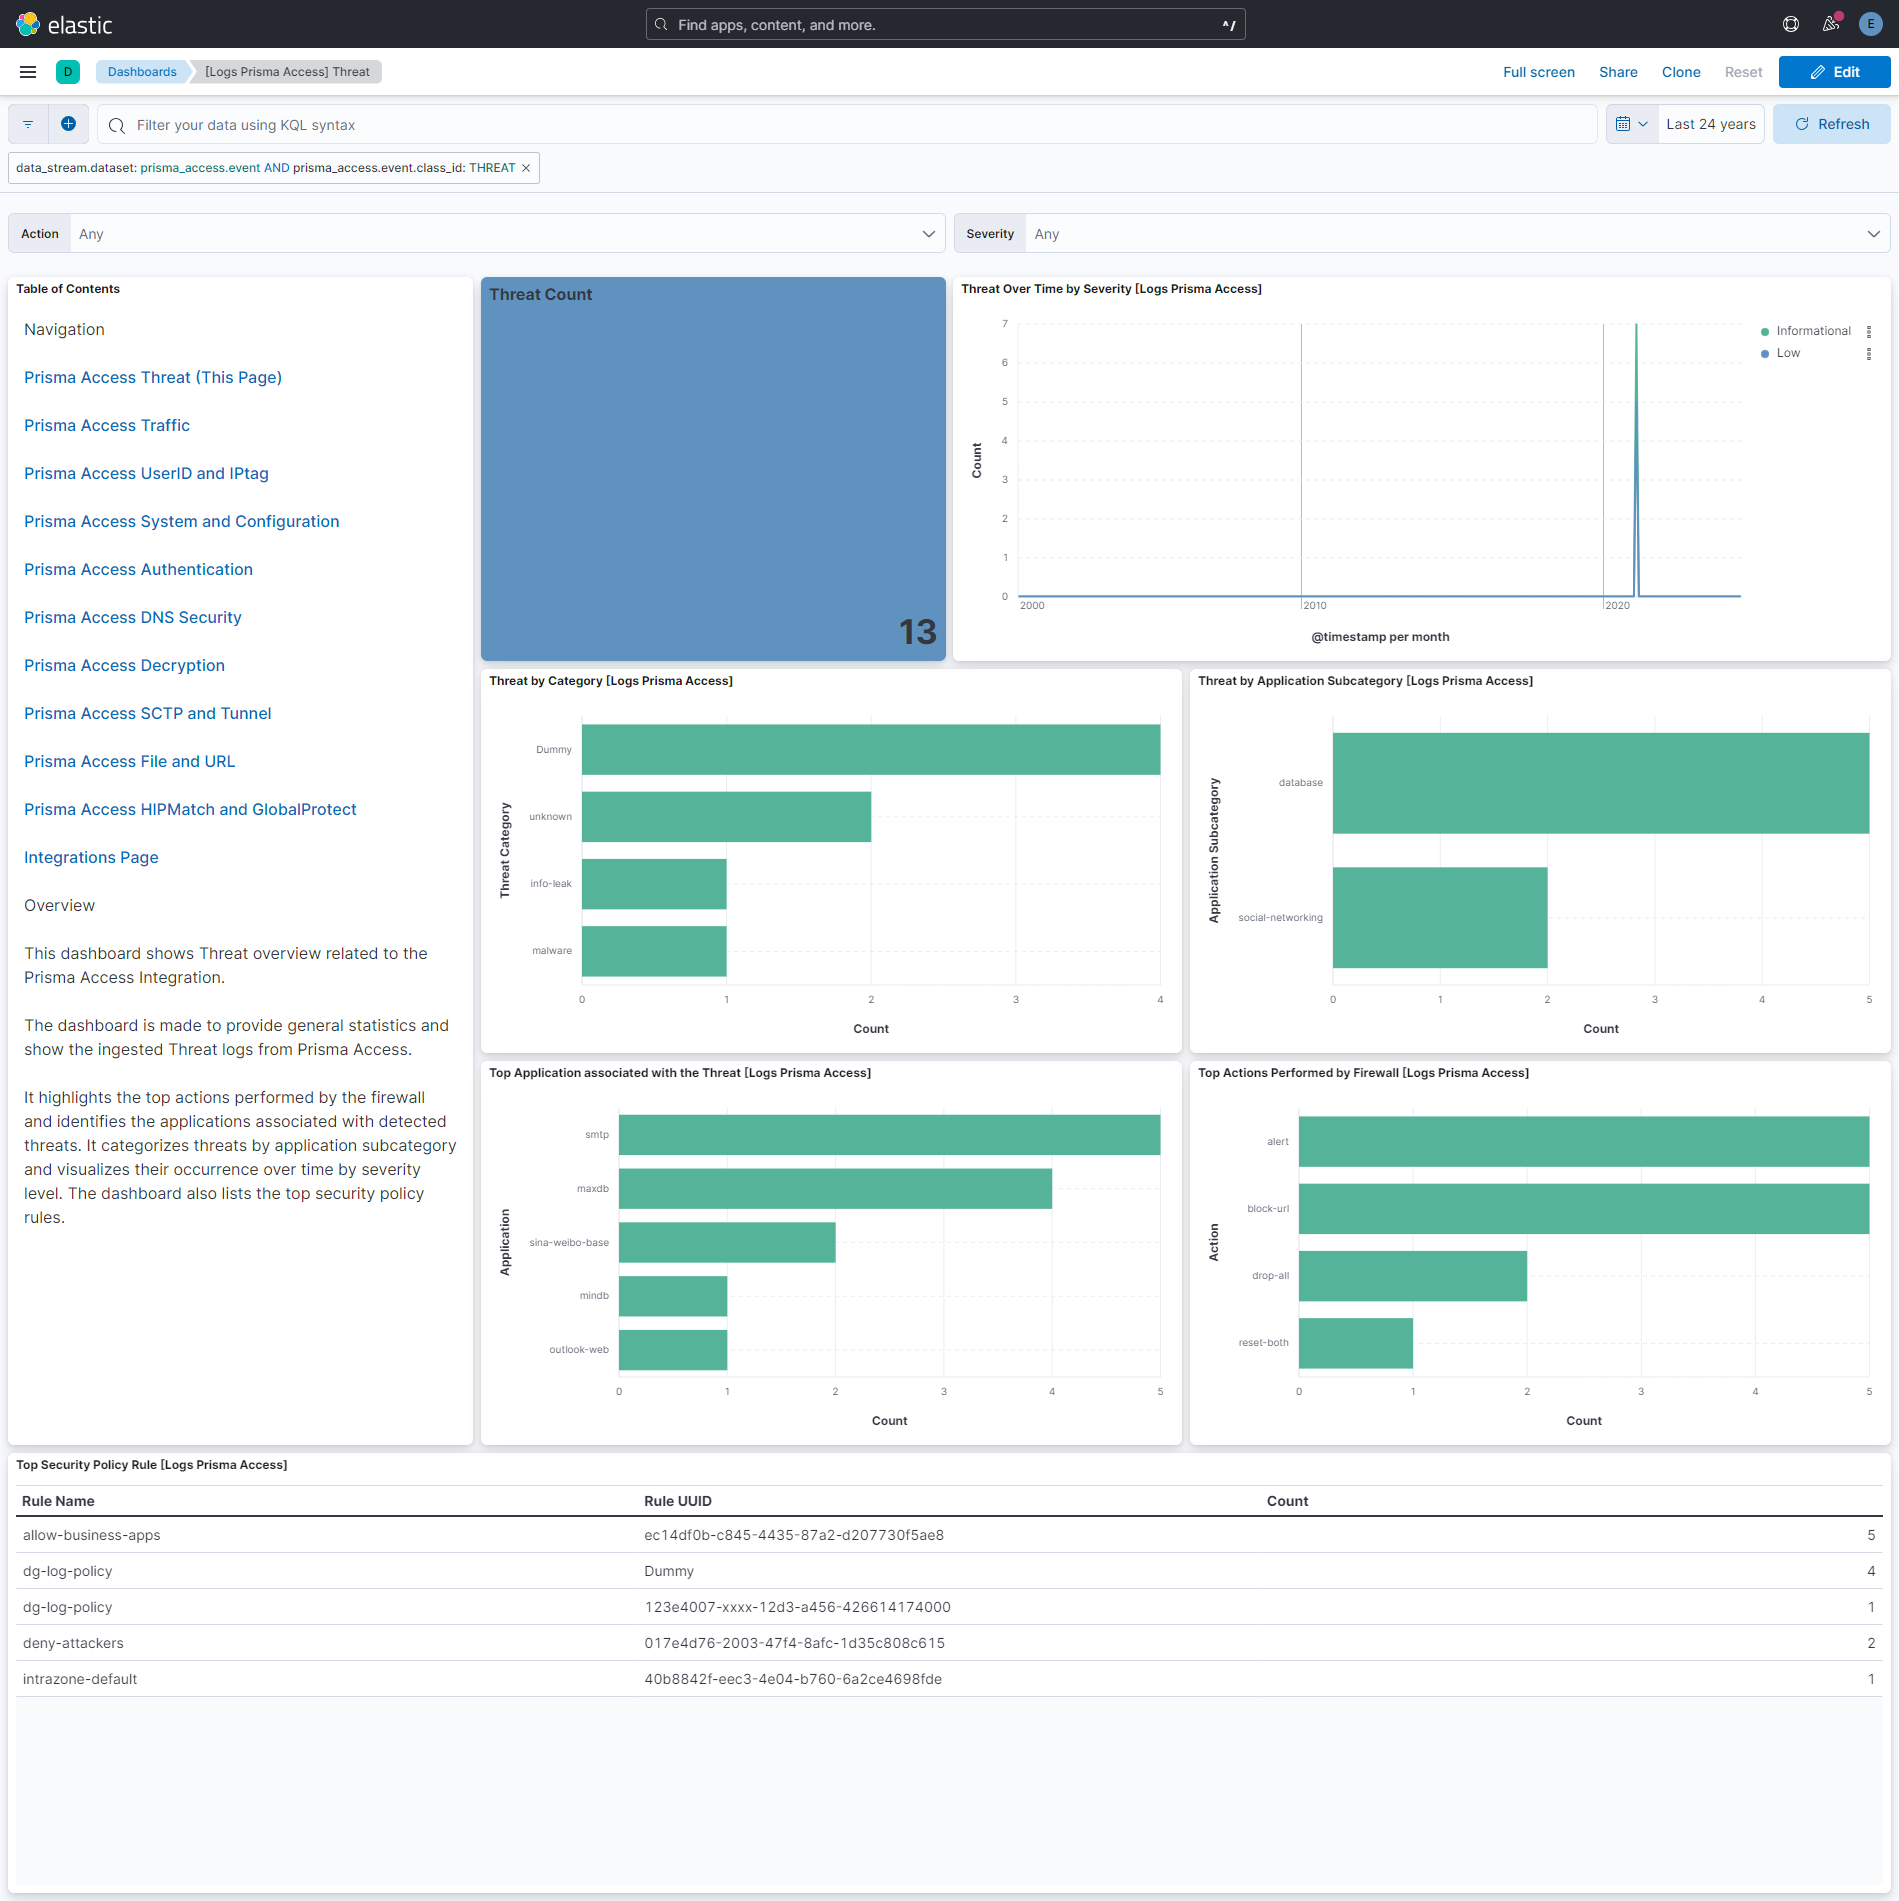
Threat - Threat logs contain entries for when network traffic matches one of the security profiles attached to a next-generation firewall security rule.
Traffic - Traffic logs contain entries for the end of each network session, as well as (optionally) the start of a network session.
Tunnel - Tunnel logs are written whenever a next-generation firewall is handling GTP traffic.
URL - URL logs are written by next-generation firewalls whenever network traffic matches a URL Filtering Profile attached to one or more security rules.
UserID - User-ID logs are generated whenever a user authentication event occurs using a resource to which the firewall has visibility.
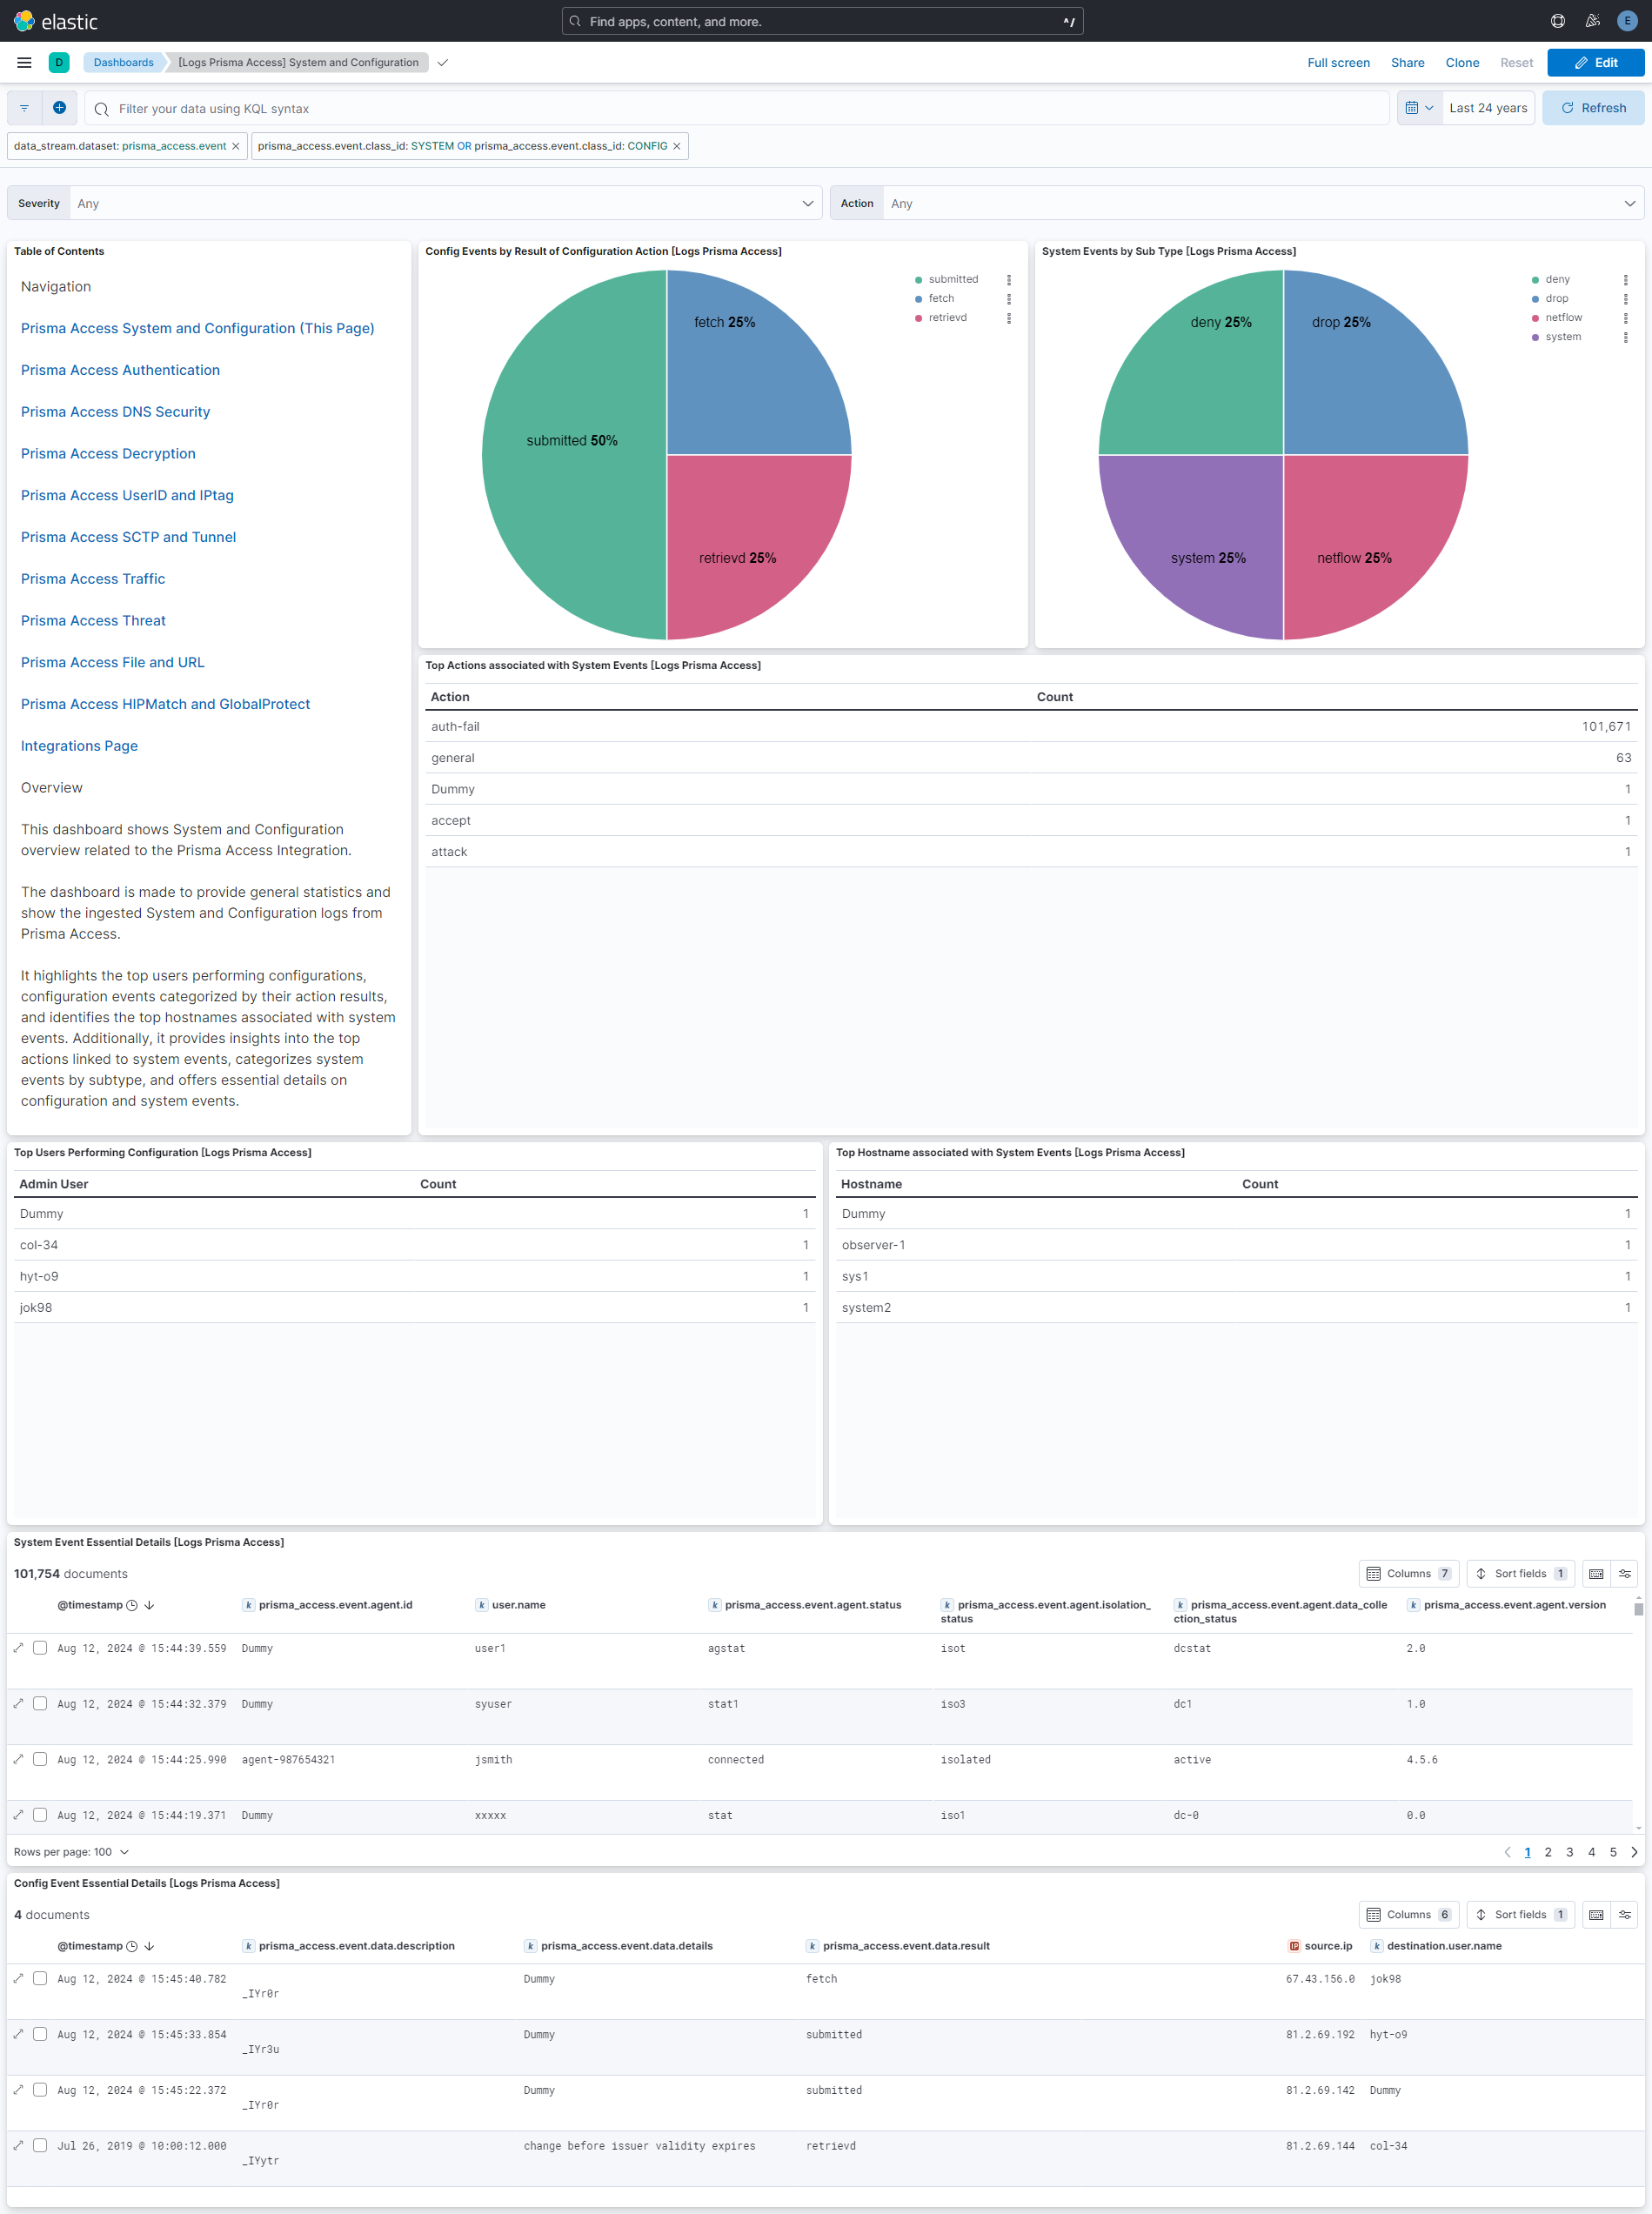
System - System logs are used to record system events that occur within the writing entity.
Configuration - Configuration logs are used to record changes made to the writing entity.
GlobalProtect App Troubleshooting - GlobalProtect App troubleshooting logs contain information about the GlobalProtect client and its host to help app users resolve issues.
The Palo Alto Prisma Access integration collects logs for different events, but we have combined all of those in one data stream named event.
Elastic Agent must be installed. For more details, check the Elastic Agent installation instructions.
For step-by-step instructions on how to forward logs to syslog server from your Palo Alto Prisma Access instance, check the Forward Logs to a Syslog Server guide.
- In Kibana navigate to Management > Integrations.
- In the search top bar, type Palo Alto Prisma Access.
- Select the Palo Alto Prisma Access integration and add it.
- Add all the required integration configuration parameters.
- Save the integration.
This is the Event dataset.
Example
{
    "@timestamp": "2019-07-25T23:30:12.000-05:00",
    "agent": {
        "ephemeral_id": "93e79bf8-525b-4819-b39a-cb8f5bb5e1fb",
        "id": "b187f216-968d-45df-8b15-0dd568e2be59",
        "name": "elastic-agent-96114",
        "type": "filebeat",
        "version": "8.18.0"
    },
    "cloud": {
        "account": {
            "id": [
                "xxxxxxxxxxxxx"
            ]
        }
    },
    "data_stream": {
        "dataset": "prisma_access.event",
        "namespace": "21364",
        "type": "logs"
    },
    "destination": {
        "user": {
            "domain": [
                "globex.org"
            ],
            "id": [
                "12345"
            ],
            "name": [
                "col-34"
            ]
        }
    },
    "ecs": {
        "version": "8.11.0"
    },
    "elastic_agent": {
        "id": "b187f216-968d-45df-8b15-0dd568e2be59",
        "snapshot": false,
        "version": "8.18.0"
    },
    "event": {
        "action": "commit-all",
        "agent_id_status": "verified",
        "category": [
            "configuration"
        ],
        "created": "2021-03-01T20:35:54.000Z",
        "dataset": "prisma_access.event",
        "id": "xxxxxxxxxxxxx",
        "ingested": "2025-08-21T10:03:41Z",
        "kind": "event",
        "original": "Mar 1 20:35:56 81.2.69.142 928 <14>1 2021-03-01T20:35:56.500Z stream-logfwd20-587718190-02280003-lvod-harness-mjdh logforwarder - panwlogs - CEF:0|Palo Alto Networks|LF|2.0|CONFIG|config|3|ProfileToken=xxxxx dtz=UTC rt=Mar 01 2021 20:35:54 deviceExternalId=xxxxxxdfrrxx PanOSEventTime=Jul 25 2019 23:30:12 duser=col-34 dntdom=globex.org duid=12345 PanOSEventDetails=change before issuer validity expires PanOSIsDuplicateLog=false PanOSIsPrismaNetwork=false PanOSIsPrismaUsers=false cat=xxxxx PanOSLogExported=false PanOSLogSource=firewall PanOSLogSourceTimeZoneOffset=-05:00 PanOSSeverity=warn PanOSTenantID=xxxxxxxxxxxxx PanOSVirtualSystemID=0 src=81.2.69.144 cs3=vsys2 cs3Label=VirtualLocation act=commit-all duser0=Panorama-admin destinationServiceName=dns PanOSEventResult=retrievd msg=uploaded details externalId=xxxxxxxxxxxxx PanOSDGHierarchyLevel1=0 PanOSDGHierarchyLevel2=0 PanOSDGHierarchyLevel3=0 PanOSDGHierarchyLevel4=0 PanOSVirtualSystemName=<{xwo X dvchost=PA-VM PanOSEventDescription=\\r_IYytr PanOSTimeGeneratedHighResolution=Jul 25 2019 23:30:12",
        "timezone": "-05:00",
        "type": [
            "info"
        ]
    },
    "input": {
        "type": "tcp"
    },
    "log": {
        "level": "warn",
        "source": {
            "address": "192.168.247.3:44262"
        }
    },
    "message": "uploaded details",
    "observer": {
        "hostname": "PA-VM",
        "product": "Prisma Access",
        "serial_number": [
            "xxxxxxdfrrxx"
        ],
        "type": "firewall",
        "vendor": "Palo Alto Networks"
    },
    "prisma_access": {
        "event": {
            "cef": {
                "device": {
                    "product": "LF",
                    "vendor": "Palo Alto Networks",
                    "version": "2.0"
                },
                "name": "config",
                "severity": 3,
                "version": "0"
            },
            "class_id": "CONFIG",
            "d_user_0": "Panorama-admin",
            "data": {
                "description": "\r_IYytr",
                "details": "change before issuer validity expires",
                "result": "retrievd",
                "time": "2019-07-25T23:30:12.000-05:00"
            },
            "destination": {
                "nt_domain": "globex.org",
                "service_name": "dns",
                "user": {
                    "id": "12345",
                    "name": "col-34"
                }
            },
            "device": {
                "action": "commit-all",
                "event": {
                    "category": "xxxxx"
                },
                "external_id": "xxxxxxdfrrxx",
                "host_name": "PA-VM",
                "receipt_time": "2021-03-01T20:35:54.000Z",
                "time_zone": "UTC"
            },
            "dg_hierarchy": {
                "level1": 0,
                "level2": 0,
                "level3": 0,
                "level4": 0
            },
            "external_id": "xxxxxxxxxxxxx",
            "is_duplicate": {
                "log": false
            },
            "is_prisma": {
                "network": false,
                "users": false
            },
            "label": {
                "cs3": "VirtualLocation"
            },
            "log": {
                "exported": false,
                "source": {
                    "timezone_offset": "-05:00",
                    "value": "firewall"
                }
            },
            "message": "uploaded details",
            "profile": {
                "token": "xxxxx"
            },
            "severity": "warn",
            "source": {
                "address": {
                    "value": "81.2.69.144"
                }
            },
            "tenant_id": "xxxxxxxxxxxxx",
            "time": {
                "generated_high_resolution": "2019-07-25T23:30:12.000Z"
            },
            "virtual": {
                "location": "vsys2",
                "system": {
                    "id": "0",
                    "name": "<{xwo X"
                }
            }
        }
    },
    "related": {
        "hosts": [
            "PA-VM"
        ],
        "ip": [
            "81.2.69.144"
        ],
        "user": [
            "12345",
            "col-34"
        ]
    },
    "source": {
        "ip": [
            "81.2.69.144"
        ]
    },
    "tags": [
        "preserve_original_event",
        "preserve_duplicate_custom_fields",
        "forwarded",
        "prisma_access-event"
    ]
}
Exported fields
| Field | Description | Type |
|---|---|---|
| @timestamp | Event timestamp. | date |
| data_stream.dataset | Data stream dataset. | constant_keyword |
| data_stream.namespace | Data stream namespace. | constant_keyword |
| data_stream.type | Data stream type. | constant_keyword |
| event.dataset | Event dataset. | constant_keyword |
| event.module | Event module. | constant_keyword |
| input.type | Type of filebeat input. | keyword |
| log.offset | Log offset. | long |
| log.source.address | Source address from which the log event read/sent. | keyword |
| prisma_access.event.access_point_name | Indicates the access point name, which is a reference to a Packet Data Network Data Gateway (PGW)/ Gateway GPRS Support Node in a mobile network. | keyword |
| prisma_access.event.agent.content_version | Version of the agent content that is installed on the endpoint. | keyword |
| prisma_access.event.agent.data_collection_status | Indicates whether data related to another product (for example, EDR) is being collected by the agent. | keyword |
| prisma_access.event.agent.id | Unique identifier for the agent at the endpoint. | keyword |
| prisma_access.event.agent.isolation_status | Indicates whether the agent is isolated. Usually, agents are isolated if they have been compromised. | keyword |
| prisma_access.event.agent.status | The protection status set for the endpoint. | keyword |
| prisma_access.event.agent.timezone_offset | Effective endpoint time zone offset from UTC, in minutes. | keyword |
| prisma_access.event.agent.version | Version of the agent at the endpoint. | keyword |
| prisma_access.event.app_tampered | Indicates whether application files on the endpoint were tampered with or modified. | boolean |
| prisma_access.event.appliance_or_cloud | FQDN of either the appliance (private) or the cloud (public) from where the file was uploaded for analysis. | keyword |
| prisma_access.event.application.category | Identifies the high-level family of the application. | keyword |
| prisma_access.event.application.characteristics | Identifies the behaviorial characteristic of the application associated with the network traffic. | keyword |
| prisma_access.event.application.container | Identifies the managing application or parent of the application associated with this network traffic. | keyword |
| prisma_access.event.application.protocol | Application associated with the network traffic. | keyword |
| prisma_access.event.application.risk | Indicates how risky the application is from a network security perspective. | keyword |
| prisma_access.event.application.subcategory | Identifies the application's subcategory. The subcategory is related to the application's category, which is identified in category_of_app. | keyword |
| prisma_access.event.application.technology | The networking technology used by the identified application. | keyword |
| prisma_access.event.assocation_end_reason | The reason the session terminated. If the termination had multiple reasons, only the highest priority reason is identified here. | keyword |
| prisma_access.event.attempted_gateways | String of all gateways that were available and attempted for the client location. Contains gateway name, ssl response time, and priority, separated by a semicolon. | keyword |
| prisma_access.event.auth.cache_service_region | Region where the service is deployed. | keyword |
| prisma_access.event.auth.factor_no | Indicates the use of primary authentication (1) or additional factors (2, 3). | long |
| prisma_access.event.auth.method | Authentication method used for the GlobalProtect connection. | keyword |
| prisma_access.event.auth.server_profile | Authentication server used for authentication. | keyword |
| prisma_access.event.authenticated.user.domain | Domain to which the user who is being authenticated belongs. | keyword |
| prisma_access.event.authenticated.user.name | Name of the user who is being authenticated. | keyword |
| prisma_access.event.authenticated.user.uuid | Unique identifier assigned to the user who is being authenticated. | keyword |
| prisma_access.event.authentication.description | Additional authentication information. | keyword |
| prisma_access.event.authentication.policy | Policy invoked for authentication before allowing access to a protected resource. | keyword |
| prisma_access.event.authentication.protocol | Indicates the authentication protocol used by the server. | keyword |
| prisma_access.event.base_event_count | Number of sessions with same Source IP, Destination IP, Application, and Content/Threat Type seen for the summary interval. | long |
| prisma_access.event.bytes.in | Number of bytes in the server-to-client network traffic. | long |
| prisma_access.event.bytes.out | Number of bytes in the client-to-server network traffic. | long |
| prisma_access.event.bytes.total | Number of total bytes (transmit and receive). | long |
| prisma_access.event.cached_configuration | Indicates whether the client is using a cached configuration to connect to the GlobalProtect portal. | boolean |
| prisma_access.event.captive_portal | Indicates if user information for the session was captured through Captive Portal. | boolean |
| prisma_access.event.cef.device.product | keyword | |
| prisma_access.event.cef.device.vendor | keyword | |
| prisma_access.event.cef.device.version | keyword | |
| prisma_access.event.cef.name | keyword | |
| prisma_access.event.cef.severity | long | |
| prisma_access.event.cef.version | keyword | |
| prisma_access.event.certificate.flags | Internal use only bit field containing raw decryption information as generated at the firewall. The information in this bit field is reflected in other decryption log fields. | keyword |
| prisma_access.event.certificate.serial | The certificate's serial number. | keyword |
| prisma_access.event.certificate.size | The size of the certificate. | long |
| prisma_access.event.certificate.version | The certificate's version number. | keyword |
| prisma_access.event.chain_status | The certificate chain verification status. | keyword |
| prisma_access.event.chunks.received | The total number of SCTP data chunks in the server-to-client network traffic. | long |
| prisma_access.event.chunks.sent | The total number of SCTP data chunks in the client-to-server network traffic. | long |
| prisma_access.event.chunks.total | The total number of SCTP data chunks in the network traffic. | long |
| prisma_access.event.class_id | Device Class ID. | keyword |
| prisma_access.event.client.to_firewall | The direction of the SSL/TLS connection is from the client to the firewall. | boolean |
| prisma_access.event.client.to_firewall_str | The direction of the SSL/TLS connection is from the client to the firewall in string format. | keyword |
| prisma_access.event.client.type.name | Type of client used to complete authentication. | keyword |
| prisma_access.event.client.type.value | Type of client used to complete authentication (such as authentication portal). | keyword |
| prisma_access.event.cloud.hostname | The hostname in which the VM-series firewall is running. | keyword |
| prisma_access.event.cloud.report_id | Unique 32 character ID for a file scanned by the DLP cloud service sent by a firewall running PAN-OS 10.2.0. | keyword |
| prisma_access.event.common.name.length | The length of the common name found on the certificate's domain name before truncation (if any). | long |
| prisma_access.event.common.name.value | The common name found on the certificate's domain name. | keyword |
| prisma_access.event.config_version | Version number of the firewall operating system that wrote this log record. | keyword |
| prisma_access.event.configuration_refresh | Indicates whether the GlobalProtect portal configuration has been refreshed. | boolean |
| prisma_access.event.connection.error.id | Enumeration integer assigned to the connection_error field value. | keyword |
| prisma_access.event.connection.error.value | Error information for unsuccessful connection. | keyword |
| prisma_access.event.connection.method | Identifies how the GlobalProtect app connected to the the Gateway. | keyword |
| prisma_access.event.container.id | Unknown field. No information is available at this time. | keyword |
| prisma_access.event.container.name.space | Container namespace. | keyword |
| prisma_access.event.container.name.value | Container name. | keyword |
| prisma_access.event.content_version | Version of the content on the firewall. | keyword |
| prisma_access.event.cortex_data_lake_tenant_id | The ID that uniquely identifies the Cortex Data Lake instance which received this log record. | keyword |
| prisma_access.event.count_of_repeats | Number of sessions with same Source IP, Destination IP, Application, and Content/Threat Type seen for the summary interval. | long |
| prisma_access.event.cpadding | For internal use only. | keyword |
| prisma_access.event.cpu_usage | The percentage of overall CPU usage on the endpoint. | double |
| prisma_access.event.crash_history | A record of any GlobalProtect application crashes. | keyword |
| prisma_access.event.d_user_0 | keyword | |
| prisma_access.event.data.code | The SCTP event notification code set for this message. | keyword |
| prisma_access.event.data.description | Description of the system event. If the source is a firewall, this is opaque. If the source is TMS, this is the msgTextEn field. | keyword |
| prisma_access.event.data.details | Identifies the firewall's configuration prior to and immediately after the configuration change. | keyword |
| prisma_access.event.data.id | Identifies the event. | keyword |
| prisma_access.event.data.outcome | The status (success or failure) of the event. | keyword |
| prisma_access.event.data.result | Result of the configuration action. | keyword |
| prisma_access.event.data.time | Time when the log was generated on the firewall's data plane. This string contains a timestamp value that is the number of microseconds since the Unix epoch. | date |
| prisma_access.event.debug_log_file | The name of a file containing debug logs. | keyword |
| prisma_access.event.description | Additional information regarding the event. | keyword |
| prisma_access.event.destination.address.v6 | Original destination IP address. | ip |
| prisma_access.event.destination.address.value | Original destination IP address. | ip |
| prisma_access.event.destination.device.category | Category of the device to which the session was directed. | keyword |
| prisma_access.event.destination.device.class | Destination device class. | keyword |
| prisma_access.event.destination.device.host | Hostname of the device to which the session was directed. | keyword |
| prisma_access.event.destination.device.mac | MAC Address of the device to which the session was directed. | keyword |
| prisma_access.event.destination.device.model | Model of the device to which the session was directed. | keyword |
| prisma_access.event.destination.device.os.family | OS family of the device to which the session was directed. | keyword |
| prisma_access.event.destination.device.os.type | Destination device OS type. | keyword |
| prisma_access.event.destination.device.os.version | OS version of the device to which the session was directed. | keyword |
| prisma_access.event.destination.device.profile | Profile of the device to which the session was directed. | keyword |
| prisma_access.event.destination.device.vendor | Vendor of the device to which the session was directed. | keyword |
| prisma_access.event.destination.dynamic_address_group | The dynamic address group that Device-ID identifies as the destination for the traffic. | keyword |
| prisma_access.event.destination.edl | The name of the external dynamic list that contains the destination IP address of the traffic. | keyword |
| prisma_access.event.destination.host_name | Name of the user’s machine. | keyword |
| prisma_access.event.destination.location | Destination country or internal region for private addresses. | keyword |
| prisma_access.event.destination.nt_domain | Domain to which the Destination User belongs. | keyword |
| prisma_access.event.destination.port | Network traffic's destination port. If this value is 0, then the app is using its standard port. | long |
| prisma_access.event.destination.service_name | Client used by the administrator who is performing the configuration. | keyword |
| prisma_access.event.destination.translated.address | If destination NAT performed, the post-NAT destination IP address. | ip |
| prisma_access.event.destination.translated.port | Post-NAT destination port. | long |
| prisma_access.event.destination.user.domain | Domain to which the Destination User belongs. | keyword |
| prisma_access.event.destination.user.id | Unique identifier assigned to the Destination User. | keyword |
| prisma_access.event.destination.user.name | The username to which the network traffic was destined. | keyword |
| prisma_access.event.destination.user.uuid | Unique identifier assigned to the Destination User. | keyword |
| prisma_access.event.destination.uuid | Identifies the destination universal unique identifier for a guest virtual machine in the VMware NSX environment. | keyword |
| prisma_access.event.device.action | Identifies the action that the firewall took for the network traffic. | keyword |
| prisma_access.event.device.event.category | The device event category. | keyword |
| prisma_access.event.device.event.class_id | Identifies the log type. | keyword |
| prisma_access.event.device.external_id | ID that uniquely identifies the source of the log. If the source is a firewall, this is its serial number. | keyword |
| prisma_access.event.device.group | The ID and the name of the device group the firewall is in. | keyword |
| prisma_access.event.device.host_name | Name of the source of the log. That is, the hostname of the firewall that logged the network traffic. | keyword |
| prisma_access.event.device.inbound_interface | Interface from which the network traffic was sourced. | keyword |
| prisma_access.event.device.ipv6_address | Source from which mapping information is collected. | ip |
| prisma_access.event.device.name | Name of the source of the log. That is, the hostname of the firewall that logged the network traffic. | keyword |
| prisma_access.event.device.outbound_interface | Interface to which the network traffic was destined. | keyword |
| prisma_access.event.device.receipt_time | Time the log was received in Cortex Data Lake. This is populated by the platform. | date |
| prisma_access.event.device.sn | ID that uniquely identifies the source of the log. That is, the serial number of the firewall that generated the log. | keyword |
| prisma_access.event.device.time_zone | The difference between the time zone of the endpoint and GMT. | keyword |
| prisma_access.event.device.vendor | Identifies the vendor that produced the data. | keyword |
| prisma_access.event.dg_hierarchy.level1 | A sequence of identification numbers that indicate the device group’s location within a device group hierarchy. | long |
| prisma_access.event.dg_hierarchy.level2 | A sequence of identification numbers that indicate the device group’s location within a device group hierarchy. | long |
| prisma_access.event.dg_hierarchy.level3 | A sequence of identification numbers that indicate the device group’s location within a device group hierarchy. | long |
| prisma_access.event.dg_hierarchy.level4 | A sequence of identification numbers that indicate the device group’s location within a device group hierarchy. | long |
| prisma_access.event.diam.app_id | The IANA ID assigned to the Diameter application associated with this network traffic. | keyword |
| prisma_access.event.diam.avp_code | The AVP code used by the Diameter application associated with this network traffic. | keyword |
| prisma_access.event.diameter_command_code | The Diameter command code used by this network traffic. | keyword |
| prisma_access.event.direction_of_attack | Indicates the direction of the attack. | keyword |
| prisma_access.event.disable_history | A record of the times that GlobalProtect was disabled. | keyword |
| prisma_access.event.disk_available | The disk space remaining on the endpoint. | double |
| prisma_access.event.dlp_version_flag | Indicates whether these are old or new data filtering logs. | keyword |
| prisma_access.event.dlsa_status | Indicates whether local subnet access is enabled. | boolean |
| prisma_access.event.dns.category | The DNS category verdict for the requested domain, represented by an integer. The integer represents different categories depending on the value of the protocol field. | keyword |
| prisma_access.event.dns.reachable | Indicates whether the endpoint can reach internet DNS servers. | boolean |
| prisma_access.event.dns.resolver_ip | The IP address of the DNS resolver. | ip |
| prisma_access.event.dns.response.code | The IP address that the domain in the DNS query got resolved to. | keyword |
| prisma_access.event.dns.response.value | The IP address that the domain in the DNS query got resolved to. | ip |
| prisma_access.event.dns.secuity_version | A number indicating the PAN-OS version of the firewall that generated the log. | keyword |
| prisma_access.event.domain.edl | Domain External Dynamic List. That is, the name of the external dynamic list that contains the destination domain of the traffic. | keyword |
| prisma_access.event.domain.value | The subject common name; that is, the name of the server that the certificate protects. | keyword |
| prisma_access.event.dst_zone | The networking zone the session was destined to. | keyword |
| prisma_access.event.dual_stack_tunnel_interface | Indicates whether the GlobalProtect interface is both IPv4 and IPv6 compatible. | boolean |
| prisma_access.event.dynamic_user_group.name | Dynamic user group of the user who initiated the network connection. | keyword |
| prisma_access.event.dynamic_user_group.value | Dynamic user group of the user who initiated the network connection. | keyword |
| prisma_access.event.elliptic_curve | The elliptic cryptography curve that the client and server negotiate and use for connections that use ECDHE cipher suites. | keyword |
| prisma_access.event.email_subject | Identifies the subject of an email that the sandbox determined to be malicious when it was analyzing an email link forwarded by the firewall. | keyword |
| prisma_access.event.end_time | Time when the authentication was completed. This string contains a timestamp value that is the number of microseconds since the Unix epoch. | date |
| prisma_access.event.endpoint.association_id | The ID assigned to the endpoint association used for the SCTP network traffic. | keyword |
| prisma_access.event.endpoint.cpu_architecture | The architecture of the OS type that the endpoint is running. | keyword |
| prisma_access.event.endpoint.device.domain | Domain to which the endpoint belongs. | keyword |
| prisma_access.event.endpoint.device.name | Hostname of the endpoint on which the event was logged. | keyword |
| prisma_access.event.endpoint.ip_address | IP address of the source of the event. | ip |
| prisma_access.event.endpoint.os.type | The operating system installed on the user’s machine or device (or on the client system). | keyword |
| prisma_access.event.endpoint.os.version | The version of the operating system running on the endpoint. | keyword |
| prisma_access.event.endpoint.serial_number | Serial number of the host on which GlobalProtect is installed. | keyword |
| prisma_access.event.endpoint.sn | ID that uniquely identifies the endpoint on which the GlobalProtect client is deployed. | keyword |
| prisma_access.event.endpoint.user.domain | Domain of the user who was logged into the endpoint at the time of the system event. | keyword |
| prisma_access.event.endpoint.user.name | The name of the user logged into the endpoint at the time of the system event. | keyword |
| prisma_access.event.endpoint.user.uuid | The endpoint user's unique ID. | keyword |
| prisma_access.event.enforcer_status | Indicated whether GlobalProtect is enforced for network access. | boolean |
| prisma_access.event.error.details | Details that help troubleshoot an error. | keyword |
| prisma_access.event.error.index | The elliptic cryptography curve that the client and server negotiate and use for connections that use ECDHE cipher suites. | keyword |
| prisma_access.event.error.message | The error message content. | keyword |
| prisma_access.event.error.stage | The stage when an error occurred. | keyword |
| prisma_access.event.external_id | The log entry identifier, which is incremented sequentially. Each log type has a unique number space. | keyword |
| prisma_access.event.fallback_to_ssl_reason | The reason why the GlobalProtect client fell back to SSL to connect to the gateway. | keyword |
| prisma_access.event.file.hash | The binary hash (SHA256) of the file. | keyword |
| prisma_access.event.file.id | Packet capture ID. Used to correlate threat pcap files with extended pcaps taken as a part of the session flow. | keyword |
| prisma_access.event.file.name | The name of the file that is blocked. | keyword |
| prisma_access.event.file.type | The type of the file. | keyword |
| prisma_access.event.file.url | File URL. | keyword |
| prisma_access.event.filename | Name of the object associated with the system event. | keyword |
| prisma_access.event.fingerprint | A hash of the certificate in x509 binary format. | keyword |
| prisma_access.event.firewall_to_client | The direction of the SSL/TLS connection is from the firewall to the client. | boolean |
| prisma_access.event.firewall_to_client_str | The direction of the SSL/TLS connection is from the firewall to the client in string format. | keyword |
| prisma_access.event.flow_type | Define the traffic type, whether it is for explicit proxy, transparent proxy or no proxy traffic. | keyword |
| prisma_access.event.from_zone | The networking zone from which the traffic originated. | keyword |
| prisma_access.event.gateway.address | The IP address of the GlobalProtect gateway. | ip |
| prisma_access.event.gateway.authentication | An array of the authentication methods used to connect to the GlobalProtect gateway. | keyword |
| prisma_access.event.gateway.configuration_name | The name of the GlobalProtect gateway client settings configuration. | keyword |
| prisma_access.event.gateway.logout_time | The UTC time in milliseconds when the GlobalProtect client logged out from the gateway. | date |
| prisma_access.event.gateway.priority | Priority of gateway, retrieved from portal configuration. | keyword |
| prisma_access.event.gateway.reachable | Indicates whether the gateway is reachable. | boolean |
| prisma_access.event.gateway.selection_type | Gateway Selection Method i.e automatic, preferred or manual. | keyword |
| prisma_access.event.gateway.ssl_certificate_valid | Indicates whether the gateway server certificate is valid. | boolean |
| prisma_access.event.gateway.status | The status of the GlobalProtect gateway. | keyword |
| prisma_access.event.gateway.value | Selected Gateway for the connection. | keyword |
| prisma_access.event.global_protect.client_version | GlobalProtect client version number. | keyword |
| prisma_access.event.global_protect.cpu_usage | The percentage of the endpoint's CPU resources used by GlobalProtect. | double |
| prisma_access.event.global_protect.gateway_location | Location of the Global Protect Gateway. | keyword |
| prisma_access.event.global_protect.memory_usage | The memory resources used by GlobalProtect on the endpoint. | keyword |
| prisma_access.event.global_protect.mtu | The maximum transmission unit of GlobalProtect. | long |
| prisma_access.event.global_protect.version | The GlobalProtect application version. | keyword |
| prisma_access.event.gp_host_id | A unique ID that GlobalProtect assigns to identify the host. | keyword |
| prisma_access.event.ha_session_owner | Name of cluster member in which session failed over from. | keyword |
| prisma_access.event.hip_match_type | Identifies whether the hip field represents a HIP object or a HIP profile. | keyword |
| prisma_access.event.host_id | A unique ID that GlobalProtect assigns to identify the host. | keyword |
| prisma_access.event.http.headers | The HTTP headers used in the web request. | keyword |
| prisma_access.event.http.method | Describes the HTTP Method used in the web request. | keyword |
| prisma_access.event.http.referer.fqdn | The fully qualified domain name used in the HTTP REFERER header field. | keyword |
| prisma_access.event.http.referer.port | The port used in the HTTP REFERER header field. | long |
| prisma_access.event.http.referer.protocol | The protocol used in the HTTP REFERER header field. | keyword |
| prisma_access.event.http.referer.url_path | The URL path used in the HTTP REFERER header field. | keyword |
| prisma_access.event.http2_connection | Parent session ID for an HTTP/2 connection. If the traffic is not using HTTP/2, this field is set to 0. | keyword |
| prisma_access.event.imei | A string used to group similar traffic together for logging and reporting. This value is globally defined on the firewall by the administrator. | keyword |
| prisma_access.event.imsi | ID of the tunnel being inspected or the International Mobile Subscriber Identity (IMSI) ID of the mobile user. | keyword |
| prisma_access.event.inbound_interface.details.port | Hardware port or socket from which the network traffic was sourced. | long |
| prisma_access.event.inbound_interface.details.slot | Interface slot from which the network traffic was sourced. | long |
| prisma_access.event.inbound_interface.details.type | The type of interface from which the network traffic was sourced. | keyword |
| prisma_access.event.inbound_interface.details.unit | Internal use. | long |
| prisma_access.event.inbound_interface.value | Interface from which the network traffic was sourced. | keyword |
| prisma_access.event.inline_ml_verdict | A verdict that identifies the nature of the threat based on the Inline ML model used to analyze the webpage. | keyword |
| prisma_access.event.install_history | Indicates whether GlobalProtect is newly installed, upgraded, or downgraded. | boolean |
| prisma_access.event.internal.network | Indicates whether the endpoint is in an internal network. | boolean |
| prisma_access.event.internet.access | Indicates whether the endpoint has internet access. | boolean |
| prisma_access.event.ip_subnet_range | IP subnet range. | keyword |
| prisma_access.event.ipsec.enabled | Indicates whether IPsec tunnel mode s enabled. | boolean |
| prisma_access.event.ipsec.failure_reason | The reason why the IPsec tunnel connection failed. | keyword |
| prisma_access.event.is_cert.cn_truncated | Indicates whether the common name found on the certificate has been truncated due to buffer limits. | boolean |
| prisma_access.event.is_cert.ecdsa | The certificate key exchange algorithm used for the session is ECDSA. | boolean |
| prisma_access.event.is_cert.rsa | The certificate key exchange algorithm used for the session is RSA. | boolean |
| prisma_access.event.is_client_to_server | Indicates if direction of traffic is from client to server. | boolean |
| prisma_access.event.is_container | Indicates if the session is a container page access (Container Page). | boolean |
| prisma_access.event.is_decrypt_mirror | Indicates whether decrypted traffic was sent out in clear text through a mirror port. | boolean |
| prisma_access.event.is_decrypted.log | Unknown field. No information is available at this time. | boolean |
| prisma_access.event.is_decrypted.payload_forward | Unknown field. No information is available at this time. | boolean |
| prisma_access.event.is_decrypted.value | Flag that indicates that the session is decrypted. | boolean |
| prisma_access.event.is_duplicate.log | Indicates whether this log data is available in multiple locations, such as from Cortex Data Lake as well as from an on-premise log collector. | boolean |
| prisma_access.event.is_duplicate.user | Indicates whether duplicate users were found in a user group. | boolean |
| prisma_access.event.is_encrypted | Flag that indicates that the session is encrypted. | boolean |
| prisma_access.event.is_forwarded | Internal-use field that indicates if the log is being forwarded. | boolean |
| prisma_access.event.is_inspection_before_session | Unknown field. No information is available at this time. | boolean |
| prisma_access.event.is_ipv6 | Indicates whether IPV6 was used for the session. | boolean |
| prisma_access.event.is_issuer_cn_truncated | Indicates whether the common name used by the certificate's issuer has been truncated due to buffer limits. | boolean |
| prisma_access.event.is_mptcp_on | Indicates whether the option is enabled on the next-generation firewall that allows a client to use multiple paths to connect to a destination host. | boolean |
| prisma_access.event.is_nat | Indicates if the firewall is performing network address translation (NAT) for the logged traffic. | boolean |
| prisma_access.event.is_non_standard_destination_port | Indicates if the destination port is non-standard. | boolean |
| prisma_access.event.is_offloaded | Indicates whether the traffic flow is offloaded to hardware before the packets enter Linux kernel on VM/CN series. | boolean |
| prisma_access.event.is_packet_capture | Indicates whether the session has a packet capture (PCAP). | boolean |
| prisma_access.event.is_phishing | Indicates whether enterprise credentials were submitted by an end user. | boolean |
| prisma_access.event.is_prisma.network | Internal-use field. If set to 1, the log was generated on a cloud-based firewall. If 0, the firewall was running on-premise. | boolean |
| prisma_access.event.is_prisma.users | Internal use field. If set to 1, the log record was generated using a cloud-based GlobalProtect instance. If 0, GlobalProtect was hosted on-premise. | boolean |
| prisma_access.event.is_proxy | Indicates whether the SSL session is decrypted (SSL Proxy). | boolean |
| prisma_access.event.is_recon_excluded | Indicates whether source for the flow is on the firewall allow list and not subject to recon protection. | boolean |
| prisma_access.event.is_resume_session | Indicates that the decryption session was previously interrupted and is now resuming. | boolean |
| prisma_access.event.is_root_cn_truncated | Indicates whether the common name used for the root CA has been truncated due to buffer limits. | boolean |
| prisma_access.event.is_saas_application | Internal use field. Indicates whether the application associated with this network traffic is a SAAS application. | boolean |
| prisma_access.event.is_server_to_client | Indicates if direction of traffic is from server to client. | boolean |
| prisma_access.event.is_sni_truncated | Indicates whether the server name indication (SNI), which is the hostname of the server that the client is trying to reach, has been truncated due to buffer limits. | boolean |
| prisma_access.event.is_source_x_forwarded | Indicates whether the X-Forwarded-For value from a proxy is in the source user field. | boolean |
| prisma_access.event.is_system_return | Indicates whether symmetric return was used to forward traffic for this session. | boolean |
| prisma_access.event.is_transaction | Indicates whether the log corresponds to a transaction within an HTTP proxy session (Proxy Transaction). | boolean |
| prisma_access.event.is_tunnel_inspected | Indicates whether the payload for the outer tunnel was inspected. | boolean |
| prisma_access.event.is_url_denied | Indicates whether the session was denied due to a URL filtering rule. | boolean |
| prisma_access.event.issuer.common_name | The name of the organization that verified the certificate’s contents. | keyword |
| prisma_access.event.issuer.name_length | The length of the issuer's common name before truncation (if any). | long |
| prisma_access.event.jail_broken_status | Indicates whether the mobile device is jailbroken. | boolean |
| prisma_access.event.jitter | The gateway jitter in milliseconds. | long |
| prisma_access.event.justification | Justification string. | keyword |
| prisma_access.event.label.c6a1 | keyword | |
| prisma_access.event.label.c6a2 | keyword | |
| prisma_access.event.label.c6a3 | keyword | |
| prisma_access.event.label.cs1 | keyword | |
| prisma_access.event.label.cs2 | keyword | |
| prisma_access.event.label.cs3 | keyword | |
| prisma_access.event.label.cs4 | keyword | |
| prisma_access.event.label.cs5 | keyword | |
| prisma_access.event.label.cs6 | keyword | |
| prisma_access.event.label.flex_string | keyword | |
| prisma_access.event.last.hip_report_time | The last time GlobalProtect sent a Host Information Profile (HIP) report. | date |
| prisma_access.event.last.logout_time | The last time a user logged out of GlobalProtect in millisecond UTC. | date |
| prisma_access.event.latency | The gateway latency in milliseconds. | long |
| prisma_access.event.link.change_count | Number of times the app flapped in that session. | long |
| prisma_access.event.link.switches | Details of the links switches (up-to 4). | keyword |
| prisma_access.event.locale | The language locale name. | keyword |
| prisma_access.event.location | The geographic region/location. | keyword |
| prisma_access.event.log.exported | Indicates if this log was exported from the firewall using the firewall's log export function. | boolean |
| prisma_access.event.log.forwarded | Internal-use field that indicates if the log is being forwarded. | boolean |
| prisma_access.event.log.setting | Log forwarding profile name that was applied to the session. This name was defined by the firewall's administrator. | keyword |
| prisma_access.event.log.source.group_id | ID that uniquely identifies the logSourceGroupId of the log. That is, the log_source_id of the group. | keyword |
| prisma_access.event.log.source.timezone_offset | Time Zone offset from GMT of the source of the log. | keyword |
| prisma_access.event.log.source.value | Identifies the origin of the data. That is, the system that produced the data. | keyword |
| prisma_access.event.log.subtype | Identifies the log subtype. | keyword |
| prisma_access.event.logging_service_id | The ID that uniquely identifies the Cortex Data Lake instance which received this log record. | keyword |
| prisma_access.event.login_duration | Duration for which the connected user was logged on. | long |
| prisma_access.event.map_app_code | Mobile Application Part (MAP) operation code used for this network traffic. | keyword |
| prisma_access.event.mapping.data_source.name | User-ID source that sends the IP (Port)-User Mapping. | keyword |
| prisma_access.event.mapping.data_source.subtype | Mechanism used to identify the IP/User mappings within a data source. | keyword |
| prisma_access.event.mapping.data_source.type | Mechanism used to identify the IP/User mappings within a data source. | keyword |
| prisma_access.event.mapping.data_source.value | Source from which mapping information is collected. | keyword |
| prisma_access.event.mapping.timeout | Timeout interval after the mappings are cleared. | long |
| prisma_access.event.memory_usage | The total memory usage on the endpoint. | long |
| prisma_access.event.message | Description of this log record. | keyword |
| prisma_access.event.mfa.authentication_id | Unique ID given across primary authentication and additional (multi-factor) authentication. | keyword |
| prisma_access.event.mfa.factor_type | The vendor used to authenticate a user when multi-factor authentication is present. | keyword |
| prisma_access.event.mfa.vendor | Vendor providing additional factor authentication. | keyword |
| prisma_access.event.mobile.area_code | Area within a Public Land Mobile Network (PLMN). | keyword |
| prisma_access.event.mobile.base_station_code | Base station within an area code. | keyword |
| prisma_access.event.mobile.country_code | Mobile country code of serving core network operator. | keyword |
| prisma_access.event.mobile.ip | IP address of a mobile subscriber allocated by a PGW/GGSN. | ip |
| prisma_access.event.mobile.network_code | Mobile network code of serving core network operator. | keyword |
| prisma_access.event.mobile.subscriber_isdn | Service identity associated with the mobile subscriber. | keyword |
| prisma_access.event.name | Identifies the log subtype. | keyword |
| prisma_access.event.nat.destination.port | Post-NAT destination port. | long |
| prisma_access.event.nat.destination.value | If destination NAT performed, the post-NAT destination IP address. | ip |
| prisma_access.event.nat.source.port | Post-NAT source port. | long |
| prisma_access.event.nat.source.value | If source NAT was performed, the post-NAT source IP address. | ip |
| prisma_access.event.nat.value | Indicates if the firewall is performing network address translation (NAT) for the logged traffic. | boolean |
| prisma_access.event.network_access | Indicates whether the endpoint has network access. | boolean |
| prisma_access.event.non_standard_destination_port | Identifies the non-standard or unexpected port used by the application associated with this session. | long |
| prisma_access.event.normalize_user.domain | Domain of the normalized user. | keyword |
| prisma_access.event.normalize_user.name | Normalized version of the username being authenticated (such as appending a domain name to the username). | keyword |
| prisma_access.event.nssai_network_slice.differentiator | Network Slice Differentiator (SD part of SNSSAI). | keyword |
| prisma_access.event.nssai_network_slice.type | Network Slice Type (SST part of SNSSAI). | keyword |
| prisma_access.event.operating_system | The operating system of the device from which a user is reporting an issue. | keyword |
| prisma_access.event.outbound_interface_details.port | Hardware port or socket to which the network traffic was sent. | long |
| prisma_access.event.outbound_interface_details.slot | Interface slot to which the network traffic was sent. | long |
| prisma_access.event.outbound_interface_details.type | The type of interface to which the network traffic was sent. | keyword |
| prisma_access.event.outbound_interface_details.unit | Internal use. | long |
| prisma_access.event.packet.capture | Indicates whether the session has a packet capture (PCAP). | boolean |
| prisma_access.event.packet.loss | The percentage of packets lost from gateway traffic. | double |
| prisma_access.event.packet.value | Packet that triggered the firewall to generate this log record. | keyword |
| prisma_access.event.packets.dropped.max | Number of packets the firewall dropped because the packet exceeded the maximum number of encapsulation levels configured. | long |
| prisma_access.event.packets.dropped.protocol | Number of packets the firewall dropped because the packet contains an unknown protocol. | double |
| prisma_access.event.packets.dropped.strict | Number of packets the firewall dropped because the tunnel protocol header in the packet failed to comply with the RFC for the tunnel protocol. | double |
| prisma_access.event.packets.dropped.tunnel | Number of packets the firewall dropped because of fragmentation errors. | long |
| prisma_access.event.packets.received | Number of server-to-client packets for the session. | long |
| prisma_access.event.packets.sent | Number of client-to-server packets for the session. | long |
| prisma_access.event.packets.total | Number of total packets (transmit and receive) seen for the session. | long |
| prisma_access.event.padding | For internal use only. | keyword |
| prisma_access.event.padding3 | For internal use only. | keyword |
| prisma_access.event.pan_os.destination.user.domain | Domain to which the Destination User belongs. | keyword |
| prisma_access.event.pan_os.source.user.domain | Domain to which the Source User belongs. | keyword |
| prisma_access.event.pan_os_data.destination.user.domain | Domain to which the Destination User belongs. | keyword |
| prisma_access.event.pan_os_data.destination.user.name | The Destination User. That is, the username to which the network traffic was destined. | keyword |
| prisma_access.event.pan_os_data.source.user.domain | Domain to which the Source User belongs. | keyword |
| prisma_access.event.pan_os_data.source.user.name | The Source User. That is, the username that initiated the network traffic. | keyword |
| prisma_access.event.pan_os_value.destination.user.domain | Domain to which the Destination User belongs. | keyword |
| prisma_access.event.pan_os_value.destination.user.name | The username to which the network traffic was destined. | keyword |
| prisma_access.event.pan_os_value.source.user.domain | Domain to which the Source User belongs. | keyword |
| prisma_access.event.pan_os_value.source.user.name | The username that initiated the network traffic. | keyword |
| prisma_access.event.panorama_sn | Panorama Serial associated with CDL. | keyword |
| prisma_access.event.parent.session_id | ID of the session in which this network traffic was tunneled. | keyword |
| prisma_access.event.parent.start_time | Time that the parent session began. This string contains a timestamp value that is the number of microseconds since the Unix epoch. | date |
| prisma_access.event.partial_hash | Machine learning partial hash. | keyword |
| prisma_access.event.payload_protocol_id | The associated Payload Protocol Identifier. | keyword |
| prisma_access.event.platform_type | The platform type (Valid types are VM, PA, NGFW, CNGFW). | keyword |
| prisma_access.event.policy_name | The name of the Decryption policy associated with the session. | keyword |
| prisma_access.event.portal.address | The IP address of the last connected GlobalProtect portal. | ip |
| prisma_access.event.portal.authentication | The authentication methods used to connect to the GlobalProtect portal. | keyword |
| prisma_access.event.portal.configuration_name | The name of the GlobalProtect portal configuration if the client is connected to a portal. | keyword |
| prisma_access.event.portal.gateway_latency | The network latency in milliseconds. | long |
| prisma_access.event.portal.last_connect_time | The last time the client connected to a GlobalProtect portal. | date |
| prisma_access.event.portal.reachable | Indicates whether the GlobalProtect portal is reachable and accepts a TCP connection. | boolean |
| prisma_access.event.portal.ssl_certificate_valid | Indicates whether the portal has a valid server certificate. | boolean |
| prisma_access.event.portal.status | The status of the portal before the user reported an issue. | keyword |
| prisma_access.event.portal.value | Global Protect Portal or Gateway that the user connected to. | keyword |
| prisma_access.event.private.ipv4 | Private IP address (v4) of the user that connected. | ip |
| prisma_access.event.private.ipv6 | Private IP address (v6) of the user that connected. | ip |
| prisma_access.event.privileges | Indicates whether GlobalProtect has the necessary permissions on the endpoint to function. | boolean |
| prisma_access.event.profile.name | Data filtering profile name. | keyword |
| prisma_access.event.profile.token | Profile token. | keyword |
| prisma_access.event.project_name | Reserved for future use. | keyword |
| prisma_access.event.protocol_data_unitsession_id | Protocol Data Unit session ID. | keyword |
| prisma_access.event.proxy.server | Indicates whether the endpoint is behind a proxy server. | boolean |
| prisma_access.event.proxy.type | The Decryption proxy type, such as Forward for Forward Proxy, Inbound for Inbound Inspection, No Decrypt for undecrypted traffic, Decryption Broker, GlobalProtect, and so forth. | keyword |
| prisma_access.event.public.ipv4 | Public IP address (v4) of the user that connected. | ip |
| prisma_access.event.public.ipv6 | Public IP address (v6) of the user that connected. | ip |
| prisma_access.event.quarantine_reason | Quarantine reason. | keyword |
| prisma_access.event.radio_access_technology | Identifies the type of technology used for radio access. | keyword |
| prisma_access.event.reason | Reason. | keyword |
| prisma_access.event.reason_for_data_filtering_action | Reason for data filtering action. | keyword |
| prisma_access.event.recipient_email | Identifies the recipient of an email that sandbox determined to be malicious when it was analyzing an email link forwarded by the firewall. | keyword |
| prisma_access.event.record_type | The DNS record type. | keyword |
| prisma_access.event.referer | The web page URL identified in the HTTP REFERER header field. | keyword |
| prisma_access.event.report_id | Identifies the analysis requested from the sandbox (cloud or appliance). | keyword |
| prisma_access.event.request.client_application | The User Agent field specifies the web browser that the user used to access the URL. | keyword |
| prisma_access.event.request.context | Content type of the HTTP response data. | keyword |
| prisma_access.event.request.method | The HTTP Method used in the web request. | keyword |
| prisma_access.event.request.url | Request URL. | keyword |
| prisma_access.event.root.cn_length | The length of the root CA's common name before truncation (if any). | long |
| prisma_access.event.root.common_name | The name of the root certificate authority. | keyword |
| prisma_access.event.root.status | The status of the root certificate, for example, trusted, untrusted, or uninspected. | keyword |
| prisma_access.event.rule.matched | Name of the security policy rule that the network traffic matched. | keyword |
| prisma_access.event.rule.matched_uuid | Unique identifier for the security policy rule that the network traffic matched. | keyword |
| prisma_access.event.rule.uuid | Unique identifier for the security policy rule that the network traffic matched. | keyword |
| prisma_access.event.rule.value | Name of the security policy rule that the network traffic matched. | keyword |
| prisma_access.event.s_user_0 | keyword | |
| prisma_access.event.sanctioned_state_of_app | Indicates whether the application has been flagged as sanctioned by the firewall administrator. | boolean |
| prisma_access.event.sccp_calling.gt | The Global Title (GT) specified in the called party address used for this SCCP protocol message. | keyword |
| prisma_access.event.sccp_calling.ssn | The subsystem number (SSN) specified in the called party address used for this SCCP protocol message. | long |
| prisma_access.event.sctp.cause_code | The error cause code found in the SCTP message. | keyword |
| prisma_access.event.sctp.chunk_type | Type of information contained in the SCTP data chunk. | keyword |
| prisma_access.event.sctp.event_type | The SCTP event notification type set for this message. | keyword |
| prisma_access.event.sctp.filter | The SCTP filter that the firewall applied to this network traffic. | keyword |
| prisma_access.event.sdwan.cluster.name | Name of the SD-WAN cluster. | keyword |
| prisma_access.event.sdwan.cluster.type | Type of SD-WAN cluster. Either mesh or hub-spoke. | keyword |
| prisma_access.event.sdwan.device_type | Type of SD-WAN device. Either hub or branch. | keyword |
| prisma_access.event.sdwan.fec_ratio | SDWAN forward error correction (FEC) ratio. | double |
| prisma_access.event.sdwan.policy_name | Name of the SD-WAN policy. | keyword |
| prisma_access.event.sdwan.site | Name of the SD-WAN site. | keyword |
| prisma_access.event.sender_email | Identifies the sender of an email that sandbox determined to be malicious when it was analyzing an email link forwarded by the firewall. | keyword |
| prisma_access.event.sequence_no | The log entry identifier, which is incremented sequentially. Each log type has a unique number space. | keyword |
| prisma_access.event.server.name_indication | The hostname of the server that the client is trying to contact. | keyword |
| prisma_access.event.server.perfomance | The network latency of various destination URLs configured by an administrator on Panorama. | keyword |
| prisma_access.event.session.duration | Total time taken for the network session to complete. | long |
| prisma_access.event.session.end_reason | The reason a session terminated. | keyword |
| prisma_access.event.session.id | Identifies the firewall's internal identifier for a specific network session. | keyword |
| prisma_access.event.session.owner_midx | Unknown field. No information is available at this time. | boolean |
| prisma_access.event.session.start_time | Time when the session was established. This string contains a timestamp value that is the number of microseconds since the Unix epoch. | date |
| prisma_access.event.session.tracker | Unknown field. No information is available at this time. | keyword |
| prisma_access.event.severity | Severity as defined by the platform. | keyword |
| prisma_access.event.sig_flags | Internal use only. | keyword |
| prisma_access.event.sni_length | The length of the server name indication (SNI), which is the hostname of the server that the client is trying to reach. This is the full length of the SNI before any truncation might have occurred. | long |
| prisma_access.event.source.address.v6 | Original source IP address. | ip |
| prisma_access.event.source.address.value | Source IP Address of the Request. | ip |
| prisma_access.event.source.device.category | Category of the device from which the session originated. | keyword |
| prisma_access.event.source.device.class | Source device class. | keyword |
| prisma_access.event.source.device.host | Hostname of the device from which the session originated. | keyword |
| prisma_access.event.source.device.mac | MAC Address of the device from which the session originated. | keyword |
| prisma_access.event.source.device.model | Model of the device from which the session originated. | keyword |
| prisma_access.event.source.device.os.family | OS family of the device from which the session originated. | keyword |
| prisma_access.event.source.device.os.type | Source device OS type. | keyword |
| prisma_access.event.source.device.os.version | OS version of the device from which the session originated. | keyword |
| prisma_access.event.source.device.profile | Profile of the device from which the session originated. | keyword |
| prisma_access.event.source.device.vendor | Vendor of the device from which the session originated. | keyword |
| prisma_access.event.source.dynamic_address_group | The dynamic address group that Device-ID identifies as the source of the traffic. | keyword |
| prisma_access.event.source.edl | The name of the external dynamic list that contains the source IP address of the traffic. | keyword |
| prisma_access.event.source.host_name | Name of the device that the user used for the connection. | keyword |
| prisma_access.event.source.location | Source country or internal region for private addresses. | keyword |
| prisma_access.event.source.nt_domain | Domain to which the Source User belongs. | keyword |
| prisma_access.event.source.port | Source port utilized by the session. | long |
| prisma_access.event.source.region | Region of the Gateway (or User) that connected. | keyword |
| prisma_access.event.source.service_name | Identifies the origin of the data. That is, the system that produced the data. | keyword |
| prisma_access.event.source.translated.address | If source NAT was performed, the post-NAT source IP address. | ip |
| prisma_access.event.source.translated.port | Post-NAT source port. | long |
| prisma_access.event.source.user.domain | Domain to which the Source User belongs. | keyword |
| prisma_access.event.source.user.id | Unique identifier assigned to the Source User. | keyword |
| prisma_access.event.source.user.name | The username that initiated the network traffic. | keyword |
| prisma_access.event.source.user.uuid | Unique identifier assigned to the Source User. | keyword |
| prisma_access.event.source.uuid | Identifies the source universal unique identifier for a guest virtual machine in the VMware NSX environment. | keyword |
| prisma_access.event.source.value | Source. | keyword |
| prisma_access.event.split_tunnel_configuration | Indicates the status of a split tunnel configured on GlobalProtect. | boolean |
| prisma_access.event.ssl.failure_reason | The reason why the SSL tunnel connection failed. | keyword |
| prisma_access.event.ssl.response_time | SSL Response Time in milliseconds. | long |
| prisma_access.event.stage | Name of the stage in the GlobalProtect connection workflow. | keyword |
| prisma_access.event.standard_ports_of_app | Standard Ports of App. | long |
| prisma_access.event.start_time | Time when the log was generated on the firewall's data plane. This string contains a timestamp value that is the number of microseconds since the Unix epoch. | date |
| prisma_access.event.stream_id | Identifies the firewall's internal identifier for the SCTP stream. | keyword |
| prisma_access.event.tag.name | The tag mapped to the source IP address. | keyword |
| prisma_access.event.tag.value | The tag mapped to the user. | keyword |
| prisma_access.event.template | The ID and name of the template/template stack to which the firewall belonged where the log was generated. | keyword |
| prisma_access.event.tenant_id | The ID that uniquely identifies the Cortex Data Lake instance which received this log record. | keyword |
| prisma_access.event.threat.category | Threat category of the detected threat. | keyword |
| prisma_access.event.threat.id | The Global Threat ID of the requested domain. If there is a threat signature associated with the DNS request, this is a Palo Alto Networks threat ID. | keyword |
| prisma_access.event.threat.name_firewall | Threat Name written by the firewall. | keyword |
| prisma_access.event.time.generated_high_resolution | Time the log was generated in data plane with millisec granularity in format YYYY-MM-DDTHH:MM:SS[.DDDDDD]Z. | date |
| prisma_access.event.time.not_after | Timestamp date after which the certificate is no longer valid. | date |
| prisma_access.event.time.not_before | Timestamp date before which the certificate is not yet valid. | date |
| prisma_access.event.time.received_management_plane | Time the log was received in the management plane in format YYYY-MM-DDTHH:MM:SS[.DDDDDD]Z. | date |
| prisma_access.event.timestamp_device_identification | Time the device was identified in format YYYY-MM-DDTHH:MM:SS[.DDDDDD]Z. | date |
| prisma_access.event.tls.auth | TLS hash algorithm. | keyword |
| prisma_access.event.tls.encryption_algorithm | The algorithm used to encrypt the session data, such as AES-128-CBC, AES-256-GCM, and so forth. | keyword |
| prisma_access.event.tls.key_exchange | Algorithm used to perform the key exchange. | keyword |
| prisma_access.event.tls.version | Version of TLS used for the encrypted session represented as major.minor.patch.build. | keyword |
| prisma_access.event.to_zone | Networking zone to which the traffic was sent. | keyword |
| prisma_access.event.total.disk_space | The total disk space on the endpoint. | double |
| prisma_access.event.total.memory | The total memory on the endpoint. | long |
| prisma_access.event.total.time_elapsed | The total duration of the network session. | long |
| prisma_access.event.tpadding | For internal use only. | keyword |
| prisma_access.event.transport_protocol | IP protocol associated with the session. | keyword |
| prisma_access.event.tunnel.cause_code | GTP cause value in log responses. | keyword |
| prisma_access.event.tunnel.endpoint.id1 | Identifies the GTP tunnel in the network node. TEID1 is the first TEID in the GTP messages. | keyword |
| prisma_access.event.tunnel.endpoint.id2 | Identifies the GTP tunnel in the network node. TEID2 is the second TEID in the GTP messages. | keyword |
| prisma_access.event.tunnel.event.code | Event code describing the GTP event. | keyword |
| prisma_access.event.tunnel.event.type | Identifies the GTP event type for the traffic. | keyword |
| prisma_access.event.tunnel.inspection_rule | Name of the security policy rule in effect for the session. | keyword |
| prisma_access.event.tunnel.interface | 3GPP interface from which a GTP message is received. | keyword |
| prisma_access.event.tunnel.message_type | Identifies the GTP message type. | keyword |
| prisma_access.event.tunnel.remote.imsi_id | International Mobile Subscriber Identity (IMSI) of a remote user at the end of an S11-U tunnel. | keyword |
| prisma_access.event.tunnel.remote.user_ip | IP address of a remote user at the end of an S11-U tunnel. | ip |
| prisma_access.event.tunnel.rename | Indicates whether the pre-logon tunnel was renamed to a user tunnel. | boolean |
| prisma_access.event.tunnel.sessions.closed | Number of completed/closed sessions created. | double |
| prisma_access.event.tunnel.sessions.created | Number of inner sessions created. | double |
| prisma_access.event.tunnel.type | Tunnel Type. | keyword |
| prisma_access.event.tunnel.value | Type of tunnel. | keyword |
| prisma_access.event.tunneled_application | For internal use only. | keyword |
| prisma_access.event.type | The network type that the endpoint is accessing, such as WiFi, Ethernet, or LTE. | keyword |
| prisma_access.event.ug_flags | Bit field used to indicate the status of user and group information when the next-generation firewall is performing an IP-to-username mapping. | keyword |
| prisma_access.event.url.category.list | The list of associated URL categories. | keyword |
| prisma_access.event.url.category.value | URL category associated with the session. | keyword |
| prisma_access.event.url.counter | The column that correlates the traffic, url and sandbox logs. | long |
| prisma_access.event.url.domain | The name of the internet domain that was visited in this session. | keyword |
| prisma_access.event.url.value | The name of the internet domain that was visited in this session. | keyword |
| prisma_access.event.user.agent_string | The User Agent field specifies the web browser that the user used to access the URL. | keyword |
| prisma_access.event.user.comment | Comments that the user submitted with their issue report. | keyword |
| prisma_access.event.user.group_found | Indicates whether the user could be mapped to a group. | keyword |
| prisma_access.event.user.identified_by_source | The user name as sent by the data source. | keyword |
| prisma_access.event.username | The name of the user who reported an issue. | keyword |
| prisma_access.event.users.ip | Source IP | ip |
| prisma_access.event.users.name | Source/Destination user. | keyword |
| prisma_access.event.uuid | UUID. | keyword |
| prisma_access.event.v.padding | For internal use only. | keyword |
| prisma_access.event.v.sys_name | The name of the virtual system associated with the network traffic. | keyword |
| prisma_access.event.vdi_endpoint | Indicates whether the endpoint is a virtual desktop infrastructure (VDI). 0—The endpoint is not a VDI, 1—The endpoint is a VDI. | keyword |
| prisma_access.event.vendor_severity | Severity associated with the event. | keyword |
| prisma_access.event.verdict | The verdict on the file sent for virus analysis. | keyword |
| prisma_access.event.verification.tag1 | The verification tag set for the SCTP packet. | keyword |
| prisma_access.event.verification.tag2 | The verification tag set for the SCTP packet. | keyword |
| prisma_access.event.virtual.location | String representation of the unique identifier for a virtual system on a Palo Alto Networks firewall. | keyword |
| prisma_access.event.virtual.system.id | A unique identifier for a virtual system on a Palo Alto Networks firewall. | keyword |
| prisma_access.event.virtual.system.name | The name of the virtual system associated with the network traffic. | keyword |
| prisma_access.event.virtual.system.value | String representation of the unique identifier for a virtual system on a Palo Alto Networks firewall. | keyword |
| prisma_access.event.x_forwarded_for.ip | X-Forwarded-For IP. | ip |
| prisma_access.event.x_forwarded_for.value | The IP address of the user who requested the web page. | ip |
| tags | User defined tags. | keyword |
| url.user_info | keyword |
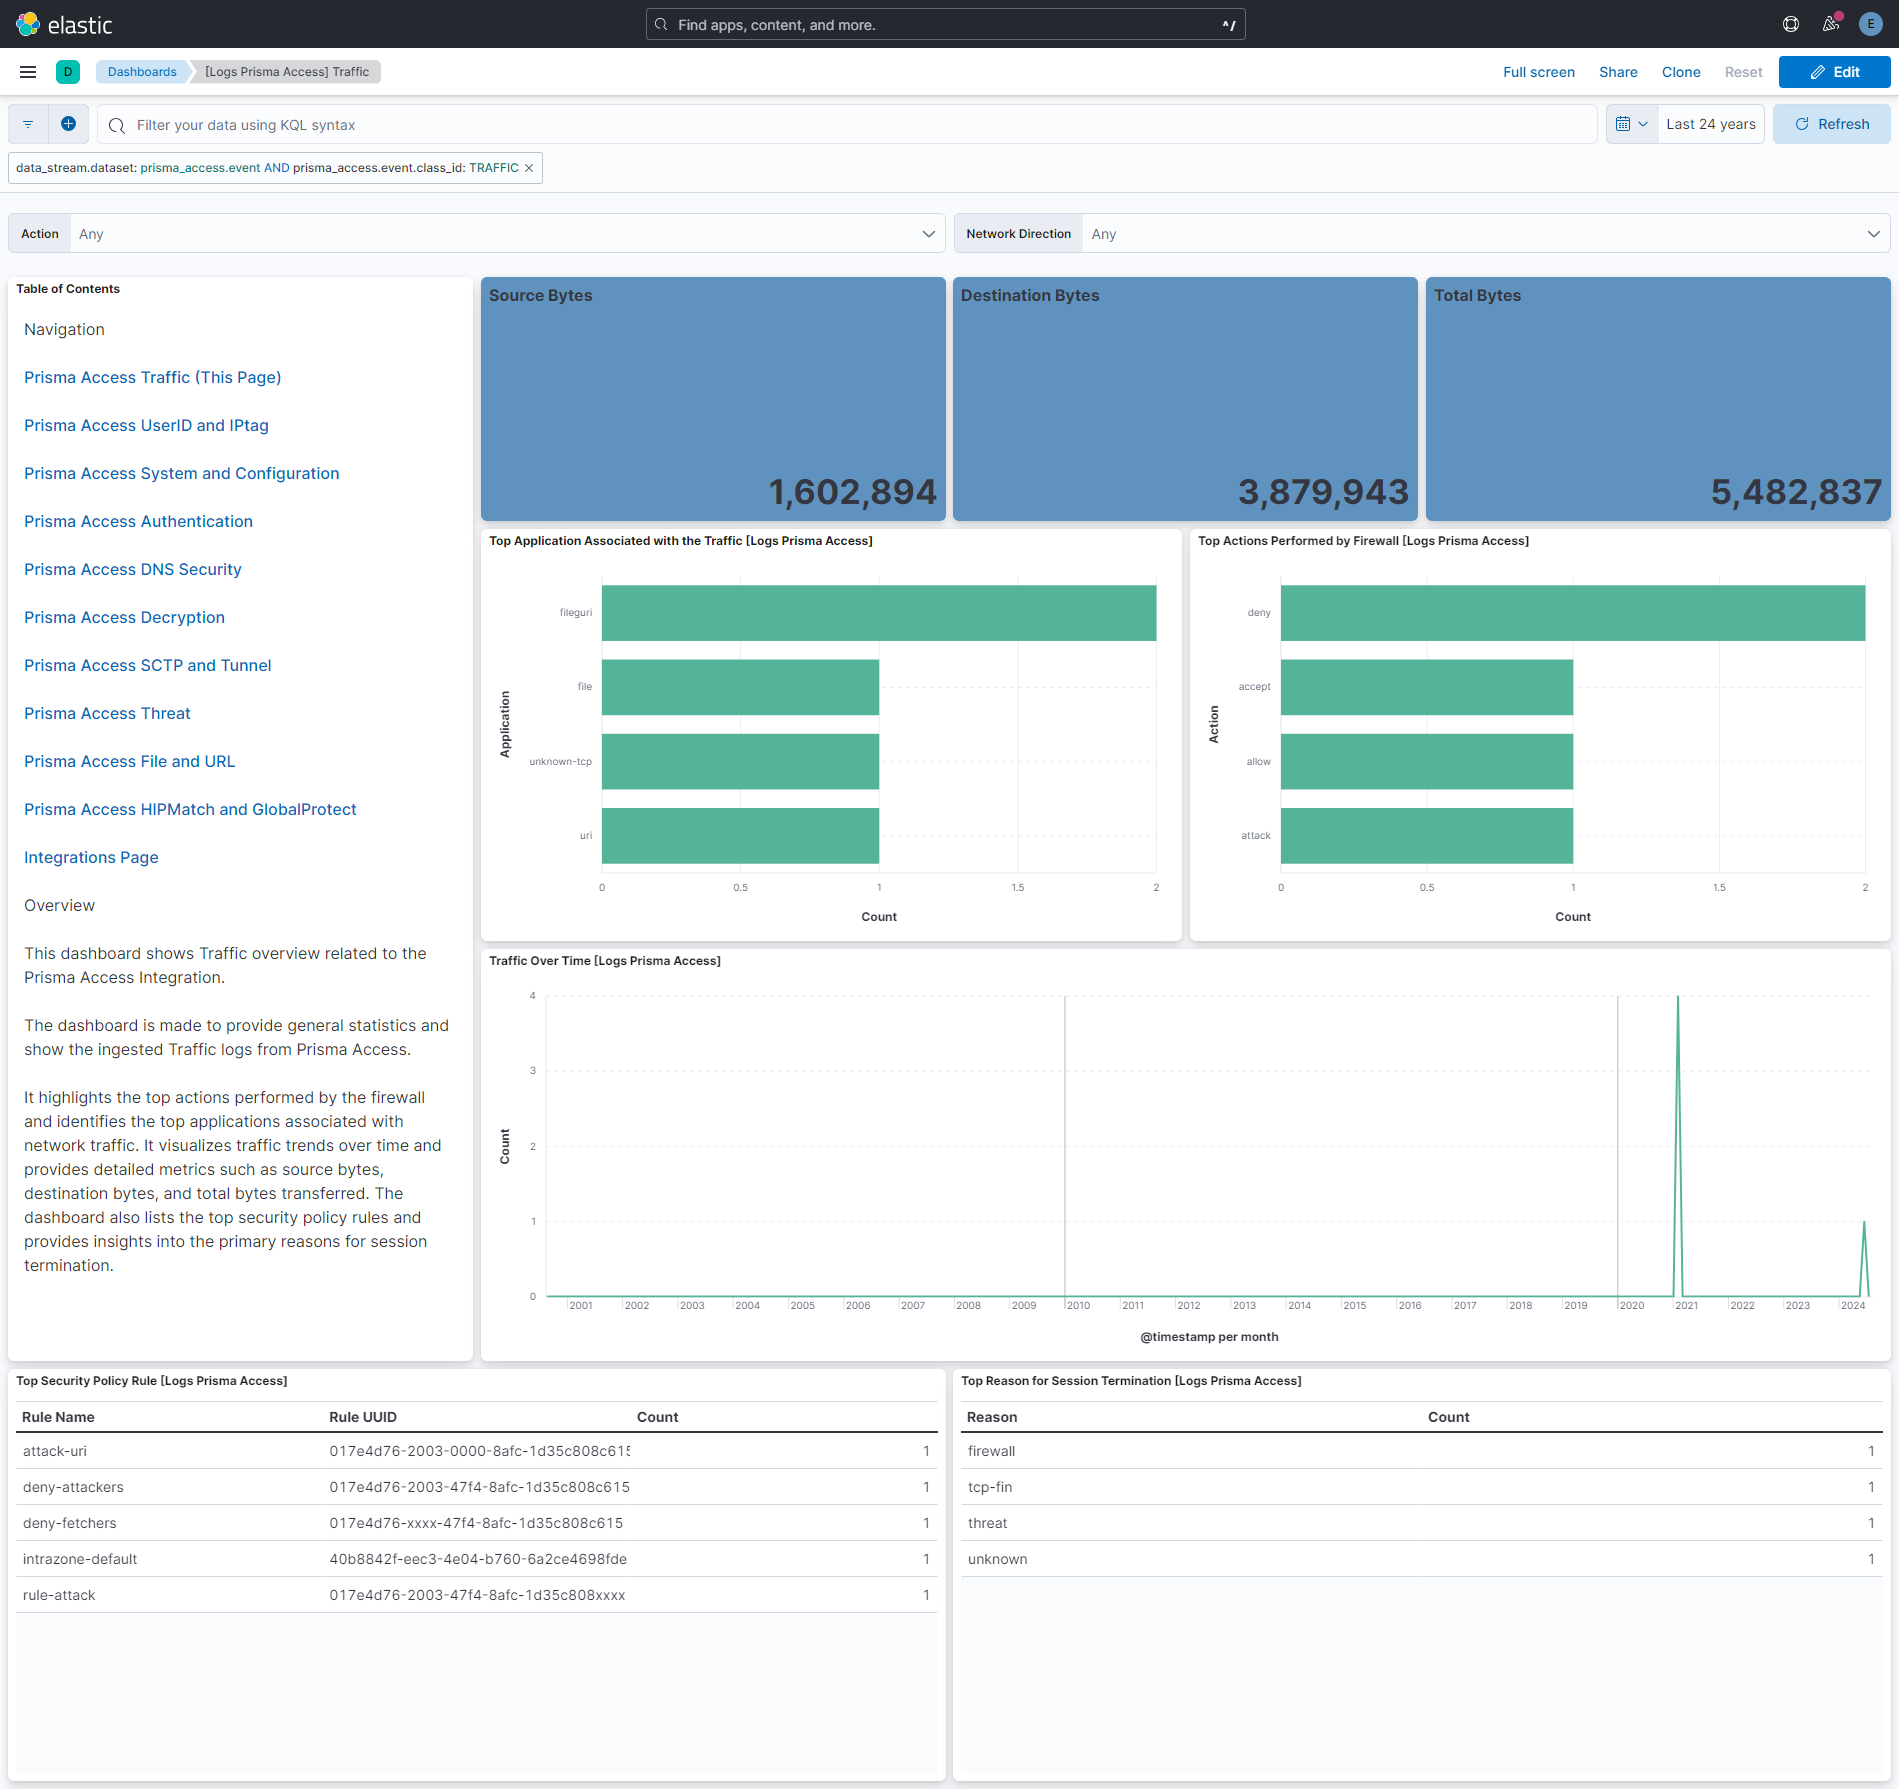
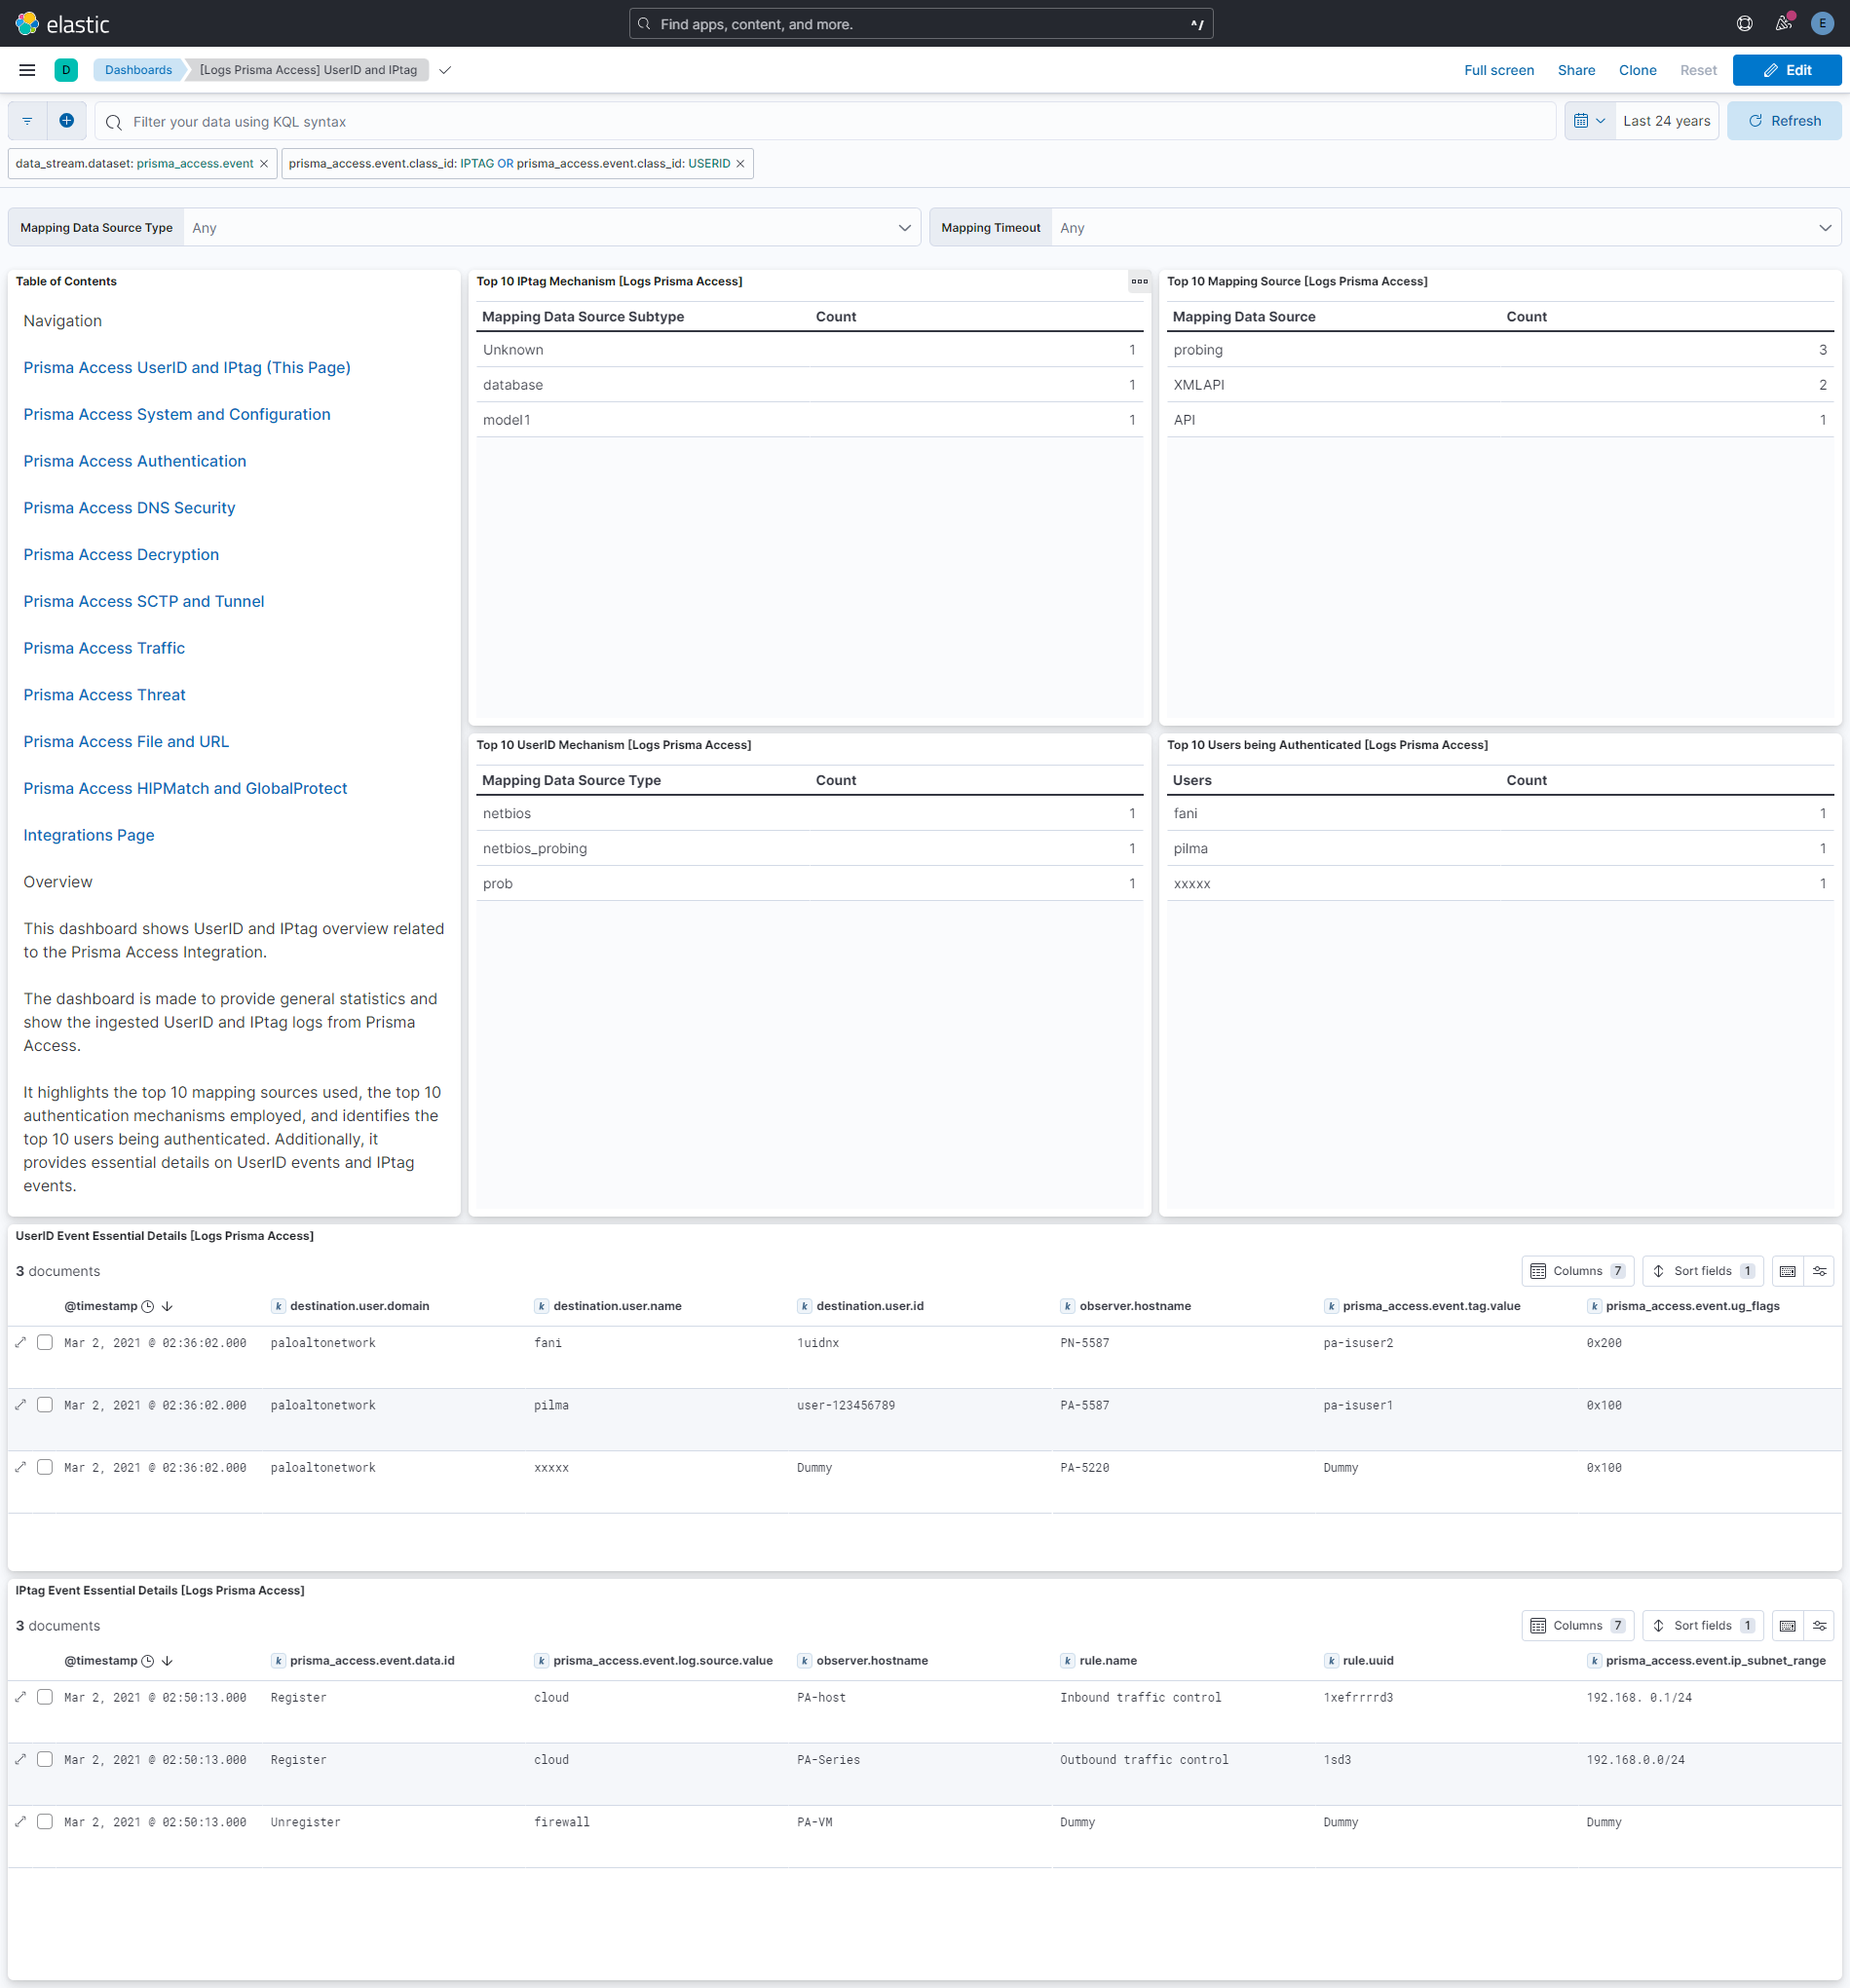
This integration includes one or more Kibana dashboards that visualizes the data collected by the integration. The screenshots below illustrate how the ingested data is displayed.
Changelog
| Version | Details | Kibana version(s) |
|---|---|---|
| 1.6.1 | Bug fix (View pull request) Add *.client.to_firewall_str and *.firewall_to_client_str fields to capture original string values whenboolean conversion fails in PanOSFirewallToClient and PanOSClientToFirewall fields. Add support for UNIX timestamp format in *.time.not_after and *.time.not_before fields.Handle malformed URL in CEF string. |
8.13.0 or higher 9.0.0 or higher |
| 1.6.0 | Enhancement (View pull request) Remove duplicated installation instructions from the documentation |
8.13.0 or higher 9.0.0 or higher |
| 1.5.0 | Enhancement (View pull request) Update Kibana constraint to support 9.0.0. |
8.13.0 or higher 9.0.0 or higher |
| 1.4.0 | Enhancement (View pull request) Handle array PanOSDNSResponse values. Enhancement (View pull request) Improve handling of PanOSRecordType values. |
8.13.0 or higher |
| 1.3.2 | Bug fix (View pull request) Do not classify THREAT events as indicators. |
8.13.0 or higher |
| 1.3.1 | Bug fix (View pull request) Updated SSL description to be uniform and to include links to documentation. |
8.13.0 or higher |
| 1.3.0 | Enhancement (View pull request) Add "preserve_original_event" tag to documents with event.kind manually set to "pipeline_error". |
8.13.0 or higher |
| 1.2.0 | Enhancement (View pull request) Do not remove event.original in main ingest pipeline. |
8.13.0 or higher |
| 1.1.0 | Enhancement (View pull request) Add "preserve_original_event" tag to documents with event.kind set to "pipeline_error". |
8.13.0 or higher |
| 1.0.0 | Enhancement (View pull request) Release package as GA. |
8.13.0 or higher |
| 0.2.0 | Enhancement (View pull request) Change the query filter from the visual level to the dashboard level. |
— |
| 0.1.0 | Enhancement (View pull request) Initial draft of the package. |
— |
