System OpenTelemetry Assets
Serverless Observability Serverless Security Stack
| Version | 0.2.3 (View all) |
| Subscription level What's this? |
Basic |
| Developed by What's this? |
Elastic |
To use beta integrations, go to the Integrations page in Kibana, scroll down, and toggle on the Display beta integrations option.
System OpenTelemetry Assets provides dashboards for vizualising OpenTelemetry hosts' metrics and logs.
Collect and ingest OpenTelemetry data from the Collector's hostmetrics receiver through:
- the Elastic Distributions of OpenTelemetry
- or using the vanilla / upstream OpenTelemetry Collector
Compatible hostmetrics receiver versions are all versions >= v0.102.0.
For full functionality of the dashboards included in this content pack, you will need to ensure the following metrics are enabled in the hostmetrics receiver:
| Metric | Enabled by default in EDOT Collector | Enabled by default in upstream Contrib Collector |
|---|---|---|
| CPU | ||
system.cpu.time |
✅ | ✅ |
system.cpu.utilization |
✅ | ❌ |
system.cpu.logical.count |
✅ | ❌ |
| Load | ||
system.cpu.load_average.1m |
✅ | ✅ |
system.cpu.load_average.5m |
✅ | ✅ |
system.cpu.load_average.15m |
✅ | ✅ |
| Memory | ||
system.memory.usage |
✅ | ✅ |
system.memory.utilization |
✅ | ❌ |
| Network | ||
system.network.connections |
✅ | ✅ |
system.network.dropped |
✅ | ✅ |
system.network.errors |
✅ | ✅ |
system.network.io |
✅ | ✅ |
system.network.packets |
✅ | ✅ |
| Disk | ||
system.disk.io |
✅ | ✅ |
system.disk.io_time |
✅ | ✅ |
system.disk.operations |
✅ | ✅ |
| File System | ||
system.filesystem.usage |
✅ | ✅ |
| Processes | ||
system.processes.count |
✅ | ✅ |
system.processes.created |
✅ | ✅ |
For step-by-step instructions on how to ingest OpenTelemetry data using Elastic's distribution of the OpenTelemetry Collector, see the quickstart guide.
Also, it's recommended to enable the resourcedetection processor with detection of the following resource attributes explicitly enabled:
host.namehost.idhost.archhost.iphost.machost.cpu.vendor.idhost.cpu.familyhost.cpu.model.idhost.cpu.model.namehost.cpu.steppinghost.cpu.cache.l2.sizeos.descriptionos.type
If individual widgets in the dashboard show errors that certain fields are not evailable, that might be an indicator of one of the following:
- For your use case the missing data is not relevant (e.g. you are only running plain, local VMs, no
Cloudmetadata will be available) - You are using the OpenTelemetry upstream Contrib Collector (or any other, non-EDOT Collector) and some of the above-mentioned requirements are not met
See also:
- Scraper limitations with the
hostmetricsreceiver for certain systems - Related EDOT Collector limitations for host metrics
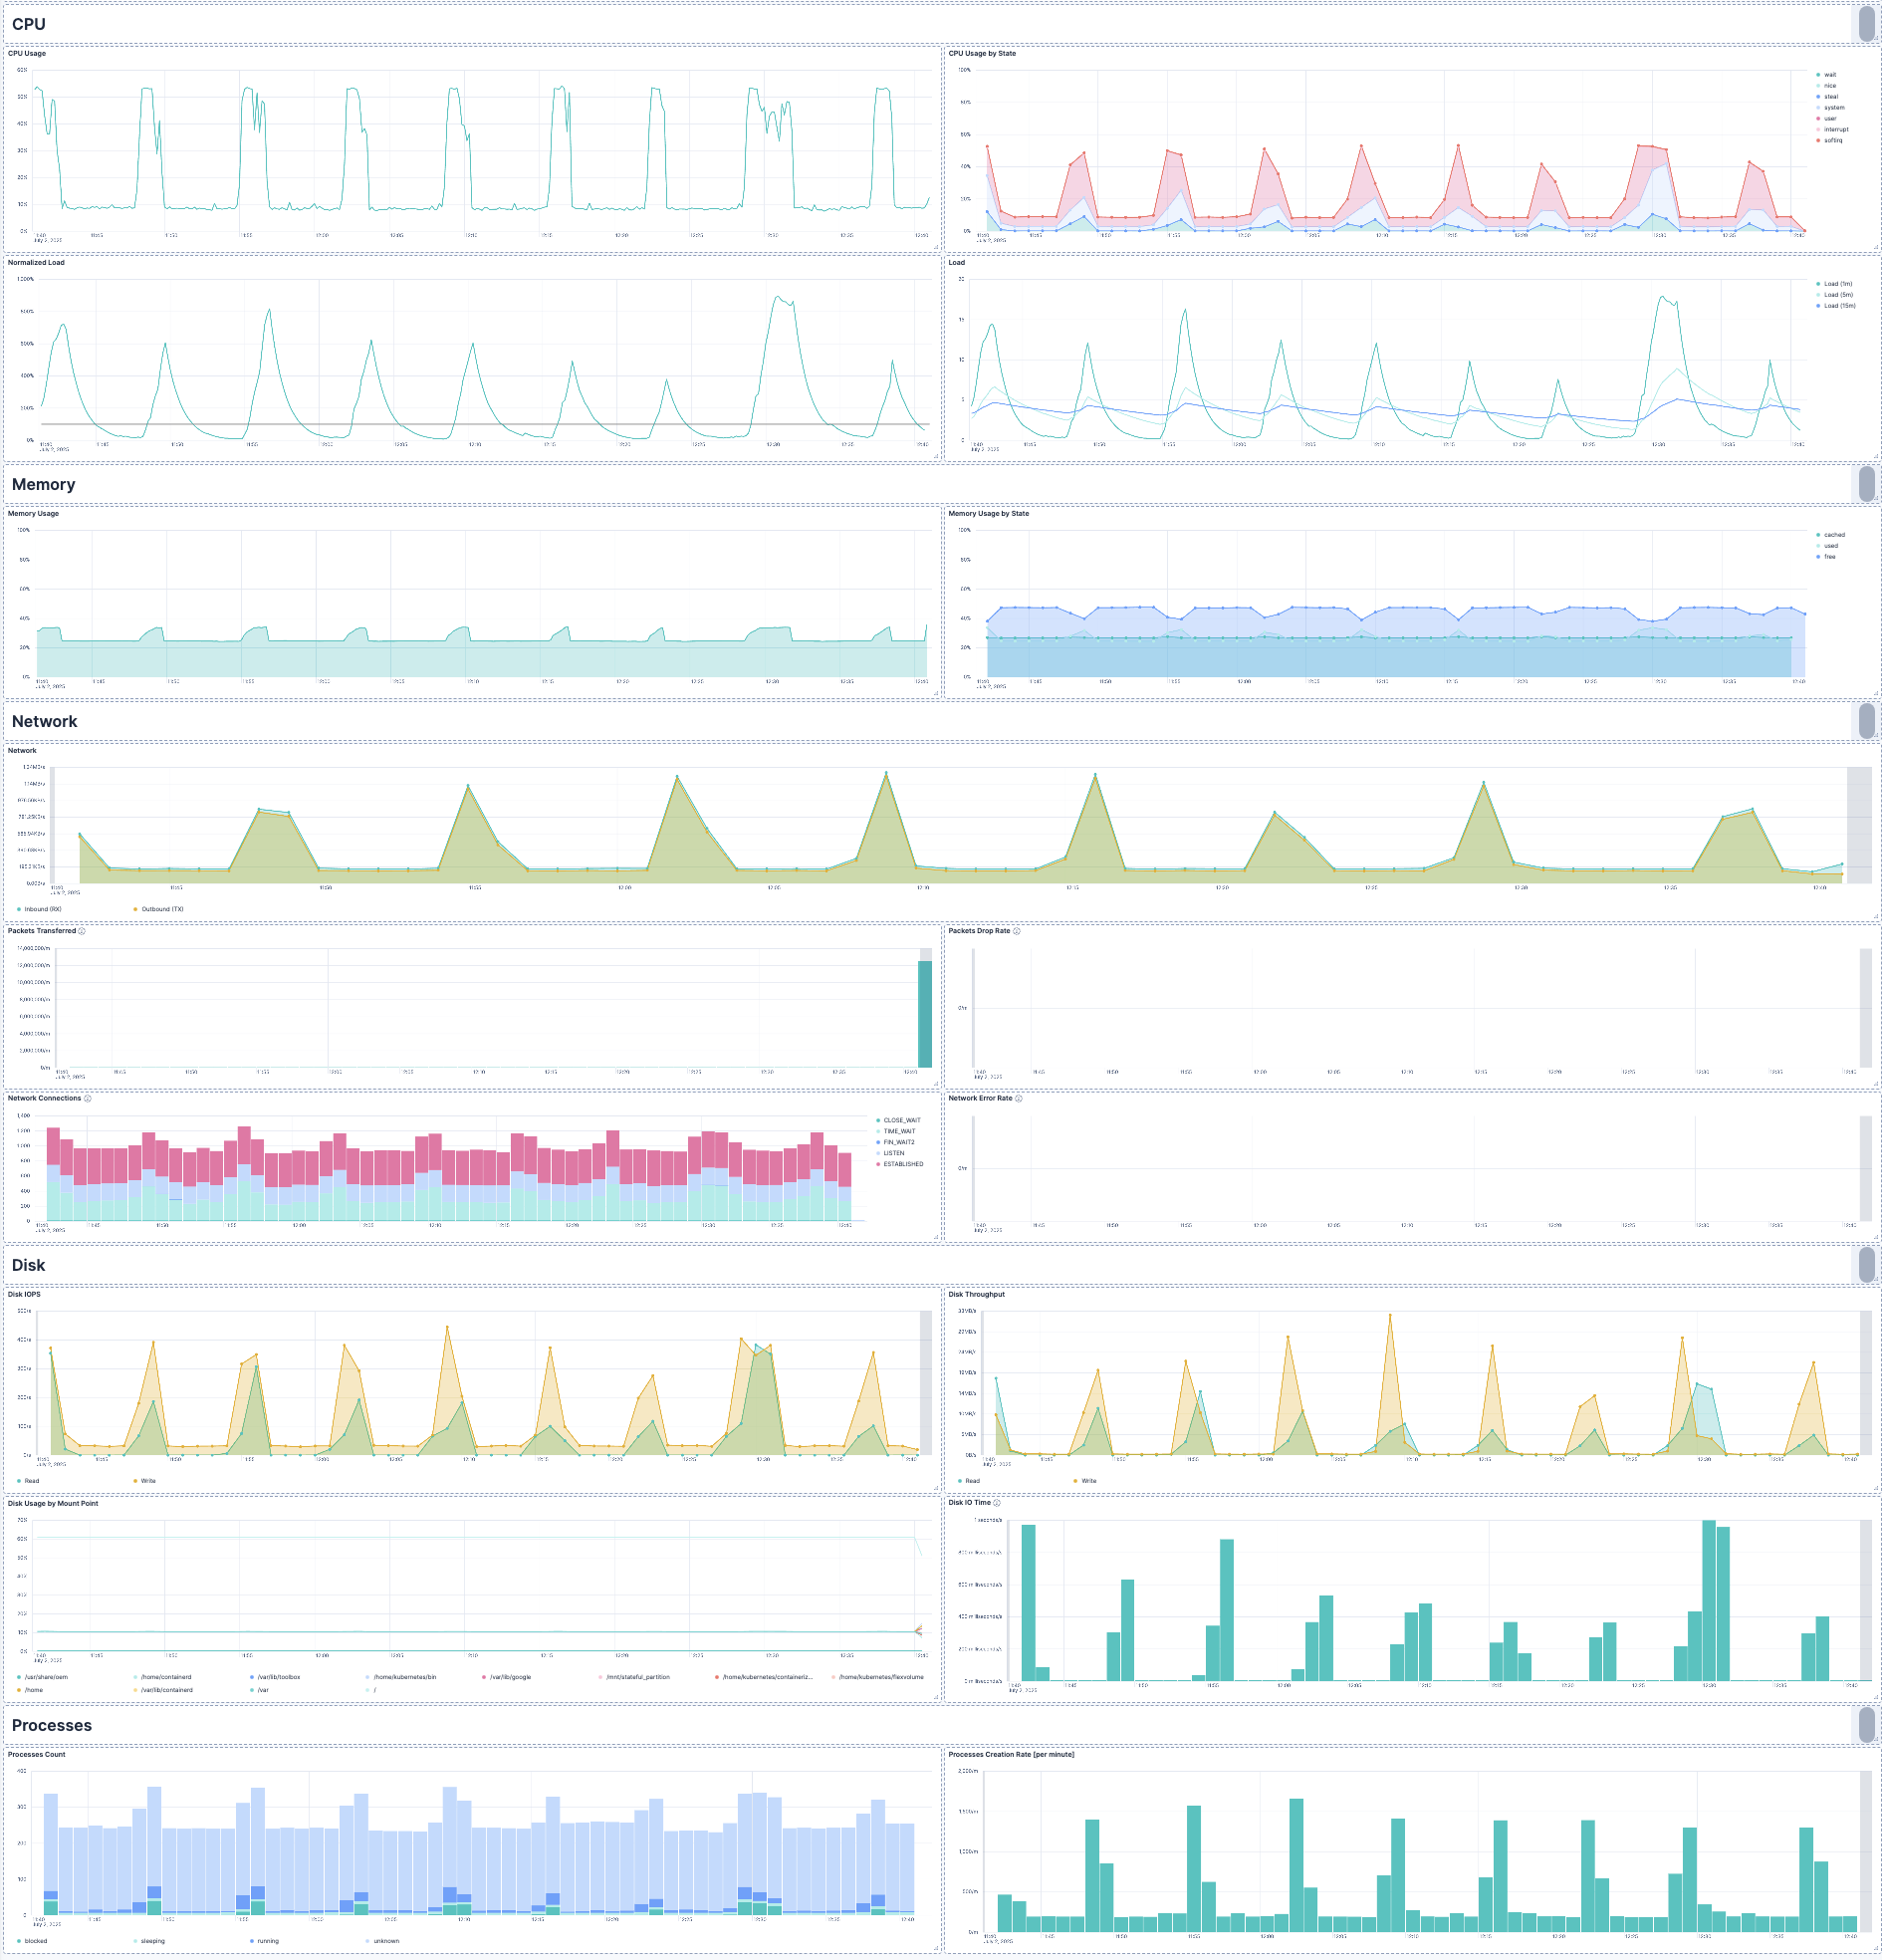
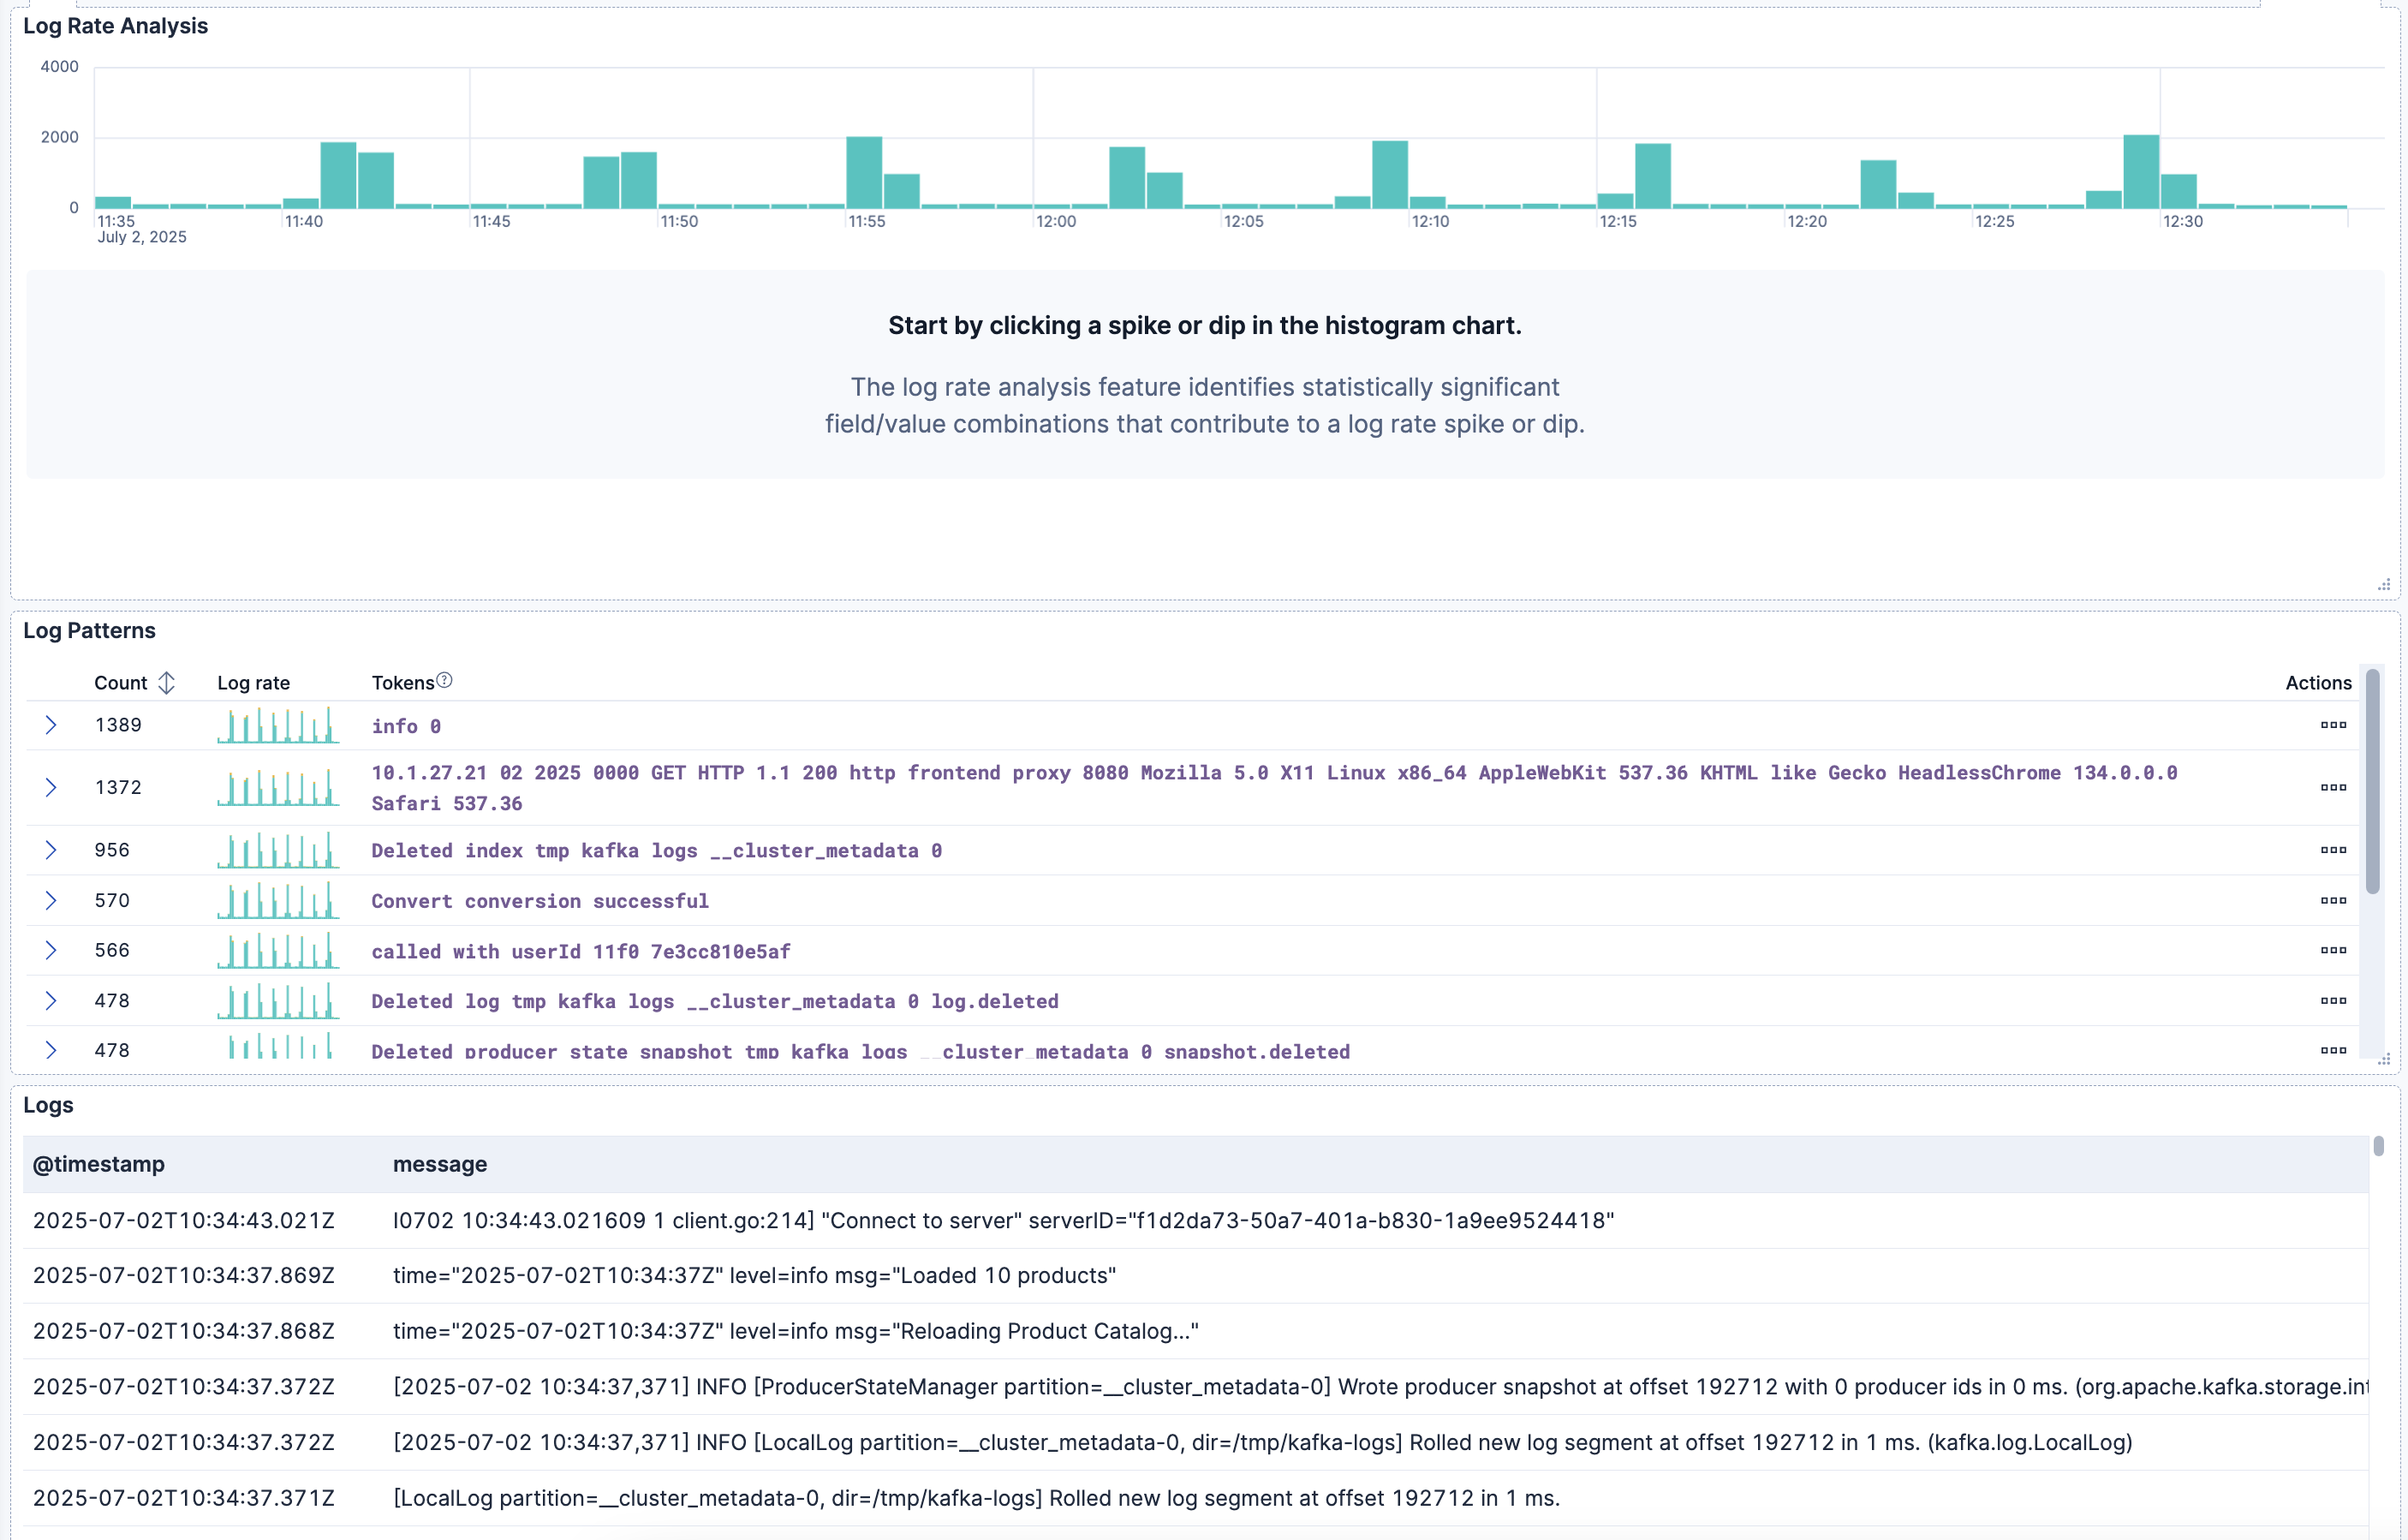
This integration includes one or more Kibana dashboards that visualizes the data collected by the integration. The screenshots below illustrate how the ingested data is displayed.
Changelog
| Version | Details | Kibana version(s) |
|---|---|---|
| 0.2.3 | Bug fix (View pull request) Use metrics-* index pattern for dataviews |
— |
| 0.2.2 | Enhancement (View pull request) Add opentelemetry category |
— |
| 0.2.1 | Bug fix (View pull request) Remove adhoc dataviews |
— |
| 0.2.0 | Enhancement (View pull request) Add discovery datasets field |
— |
| 0.1.0 | Enhancement (View pull request) Initial version of the System OpenTelemetry Assets content pack |
— |

