Explore metrics data with Discover in Kibana
Serverless Stack
This functionality is experimental and not supported. It may change or be removed at anytime.
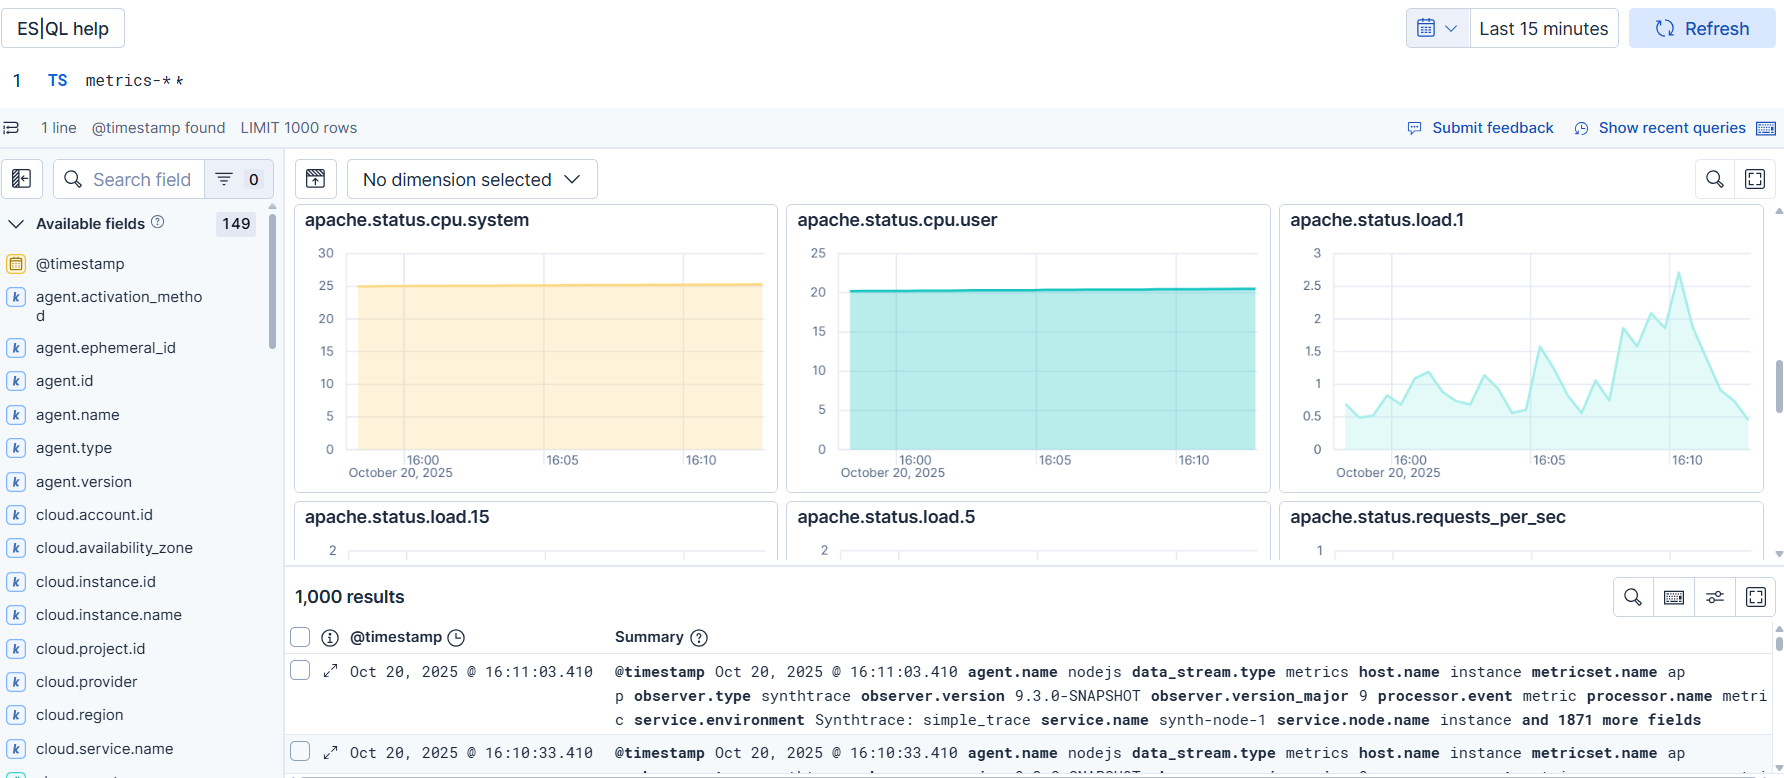
Discover offers a dedicated experience for exploring metrics data. When Discover recognizes metrics data, it enables specific features and default behaviors to optimize your data exploration. Metrics-specific exploration in Discover automatically generates a grid of charts showing available metrics from your data. Use this view to quickly search and filter metrics, break metrics down by dimension, review the ES|QL query that generates the charts, and add metrics to dashboards with a single click.
If you're just getting started with Discover and want to learn its main principles, you should get familiar with the default experience.

By default, all data stored in a metrics-* index is recognized as metrics data and triggers the Discover experience described on this page.
Viewing metrics data in Discover requires at least read privileges for Discover.
For more on assigning Kibana privileges, refer to the Kibana privileges documentation.
To visualize your metrics data as charts, its data stream needs its Index mode set to Time series. Open Index Management using the global search field, then select the Data Streams tab to find your data stream's index mode.
The dedicated metrics view is only available in ES|QL mode. From the Discover main page, select Try ES|QL to open ES|QL mode.
Use the TS command to select the data source. For example, the following query returns all of your metrics data:
TS metrics-*
You can also query a specific index:
TS metrics-index-1
With your data loaded, use the metrics charts to:
Search for specific metrics
Use the search function to find and visualize specific metric data:

Break down metrics by dimension
Break down your metrics by dimension to find metrics that contain those dimensions and identify which values in those dimensions contribute the most to each metric.

Filter dimensions by a specific value
Select specific values to focus on within the dimension. You can select up to 10 values to filter your dimension by.

View metric charts in full screen
Select full screen ( ) to view the metric charts in full-screen mode.
For each metric chart, you can perform the following actions:
- Explore in Discover ( ): Open Discover filtered to focus on that specific metric.
- Inspect ( ): Show details about the query request and response.
- View details ( ): Get additional information about the metric like metric type, dimensions, and ES|QL query.
- Copy to dashboard ( ): Save the metric chart to an existing or new dashboard.
- Add to case ( ): Add the metric chart to a case.