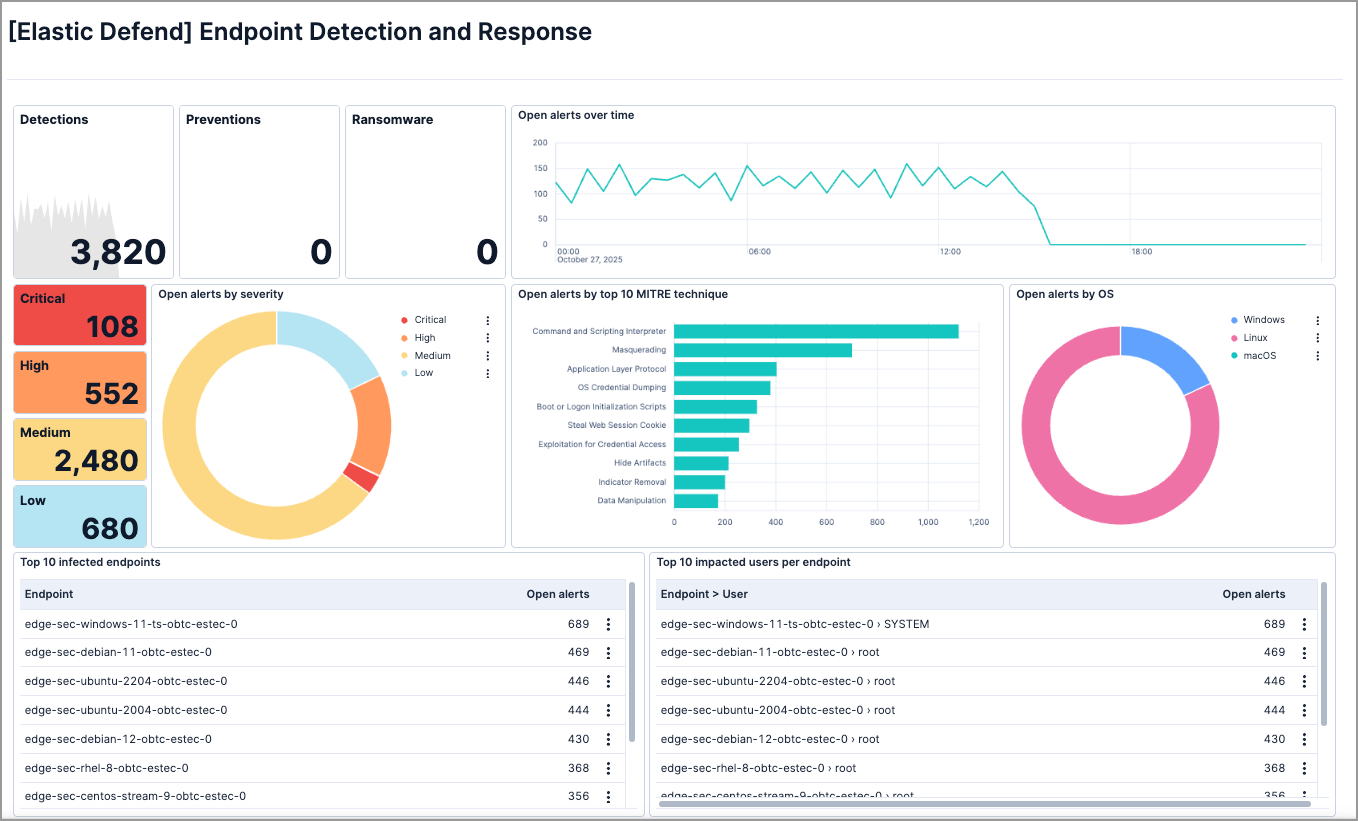
Endpoint Detection and Response dashboard
Serverless Security Stack
The Endpoint Detection and Response (EDR) dashboard provides visualizations that help you monitor and analyze detection and prevention activity on endpoints running Elastic Defend. It shows total counts of detection, prevention, and ransomware alerts, as well as open alerts by severity, MITRE technique, and operating system. It also highlights the top 10 most infected endpoints and the top 10 most impacted users per endpoint.
With these insights, security analysts and administrators can quickly identify high-risk endpoints or potentially compromised users, evaluate detection rule performance, understand environment coverage, and pivot directly into the relevant alert details to begin investigations.
To access the dashboard:
- Find Dashboards using the navigation menu or the global search field.
- In the Custom Dashboards section, search for "Endpoint Detection and Response".

To access this dashboard and its data, you must have at least Read Kibana privileges for both the Analytics > Dashboard and Security > Security Kibana features.
The dashboard presents various information about detections, preventions, and alerts from endpoints protected by Elastic Defend. Visualizations display and calculate data within the time range and filters selected at the top of the dashboard.
The following visualizations are included:
- Total detection, prevention, and ransomware alerts: Displays the total number of detection, prevention, and ransomware alerts from protected endpoints within the specified time range.
- Open alerts over time: Shows the trend of active alerts over the selected period, helping you identify spikes or patterns in alert activity.
- Open alerts by severity: Displays the distribution of open alerts by severity level.
- Open alerts by top 10 MITRE technique: Highlights the most frequent MITRE ATT&CK® techniques observed across alerts.
- Open alerts by OS: Shows the distribution of open alerts across different operating systems to help assess environment coverage.
- Top 10 infected endpoints: Displays endpoints with the most detections or alerts, enabling you to prioritize remediation and take immediate action on heavily impacted systems.
- Top 10 impacted users per endpoint: Displays users with the most detections or alerts, helping you to identify potentially compromised users linked to repeated alerts on the same endpoint.
Hover over a visualization panel to take the following actions:
- Query: View the panel's KQL query.
- Show visualization configuration: View the visualization's configuration.
- Explore in Discover: Open Discover with preloaded filters to display the panel’s data.
- Inspect: Examine the panel’s underlying data.
- Maximize: Expand the panel.
- Settings: Open the settings flyout.
- Download CSV: Download the panel’s data as a CSV file.
- Copy to dashboard: Copy the panel to an existing or new dashboard.
- Add to case: Add the panel to an existing case.
- Detect anomalies: Create a machine learning anomaly detection job using the panel’s data.
Click a visualization panel or part of a panel (such as a section of a donut chart) to take the following actions:
- Apply filter to current view: Apply the selected value as a filter to update all visualizations.
- Show: Open the Alerts page filtered by the selected value (for example, Show Medium opens alerts with medium severity, or Show ransomware opens ransomware alerts).
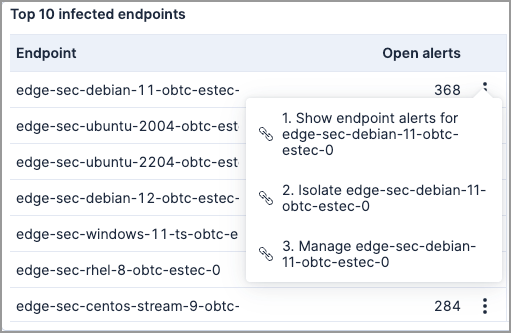
In the table panels, click the options menu ( ) to take action over endpoints or users with a high number of alerts:

This dashboard is managed by Elastic, so any changes you make to it will not persist. To make persistent changes, you can duplicate the dashboard and edit the copy. Your copy will not get updated when Elastic updates the managed dashboard.
- Click Duplicate in the toolbar.
- In the Duplicate dashboard window, enter a title and optional description and tags.
- Click Save. You will be redirected to the duplicated dashboard.