AutoOps and Stack Monitoring comparison
Serverless ECH ECK ECE Self-Managed
This page provides a detailed comparison of AutoOps and Stack Monitoring to help you decide which solution is better suited to your needs.
Review how these tools differ in their provisioning, set up procedure, method of access, and capabilities.
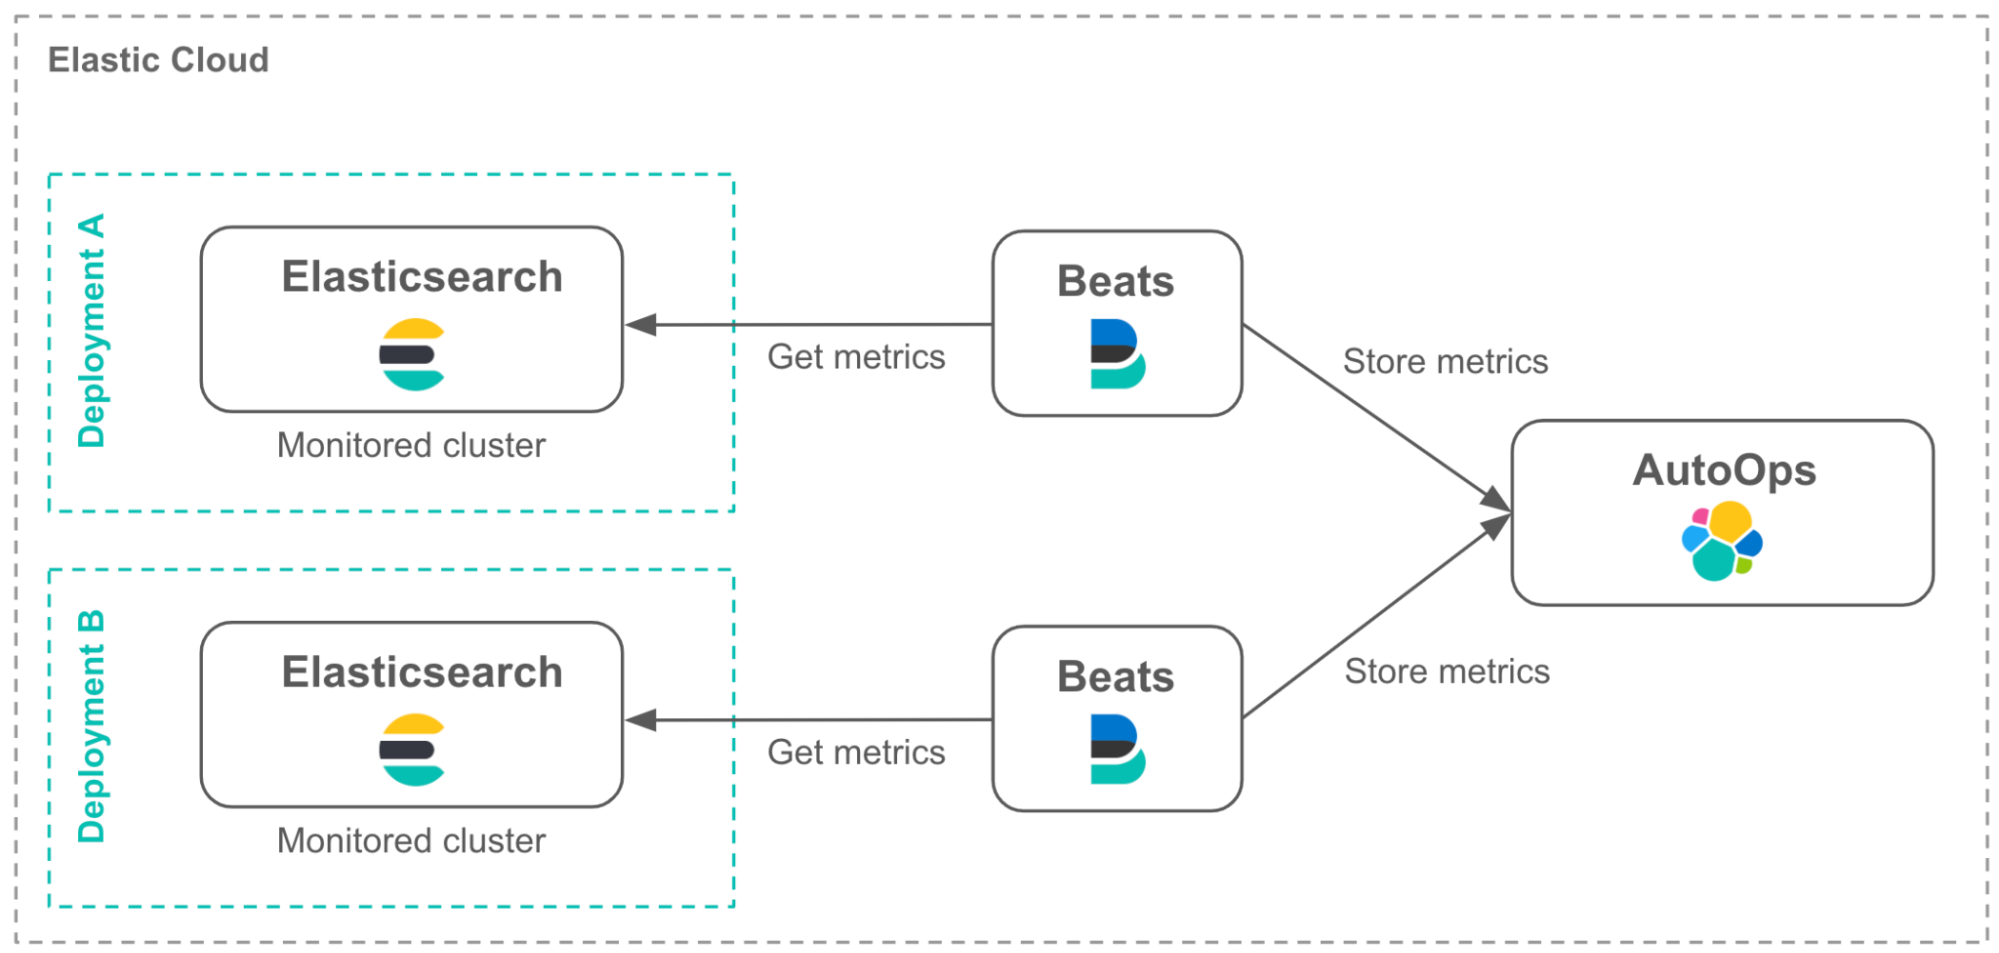
AutoOps stores and backs up your monitoring data internally on Elastic Cloud infrastructure so you don’t need to think about provisioning, sizing, and availability. The data is retained for 10 days by default. Using AutoOps is free for Elastic Cloud customers and is offered to all subscription tiers.
With Stack Monitoring, you are responsible for storing your monitoring data. This requires provisioning the necessary resources based on your performance and retention needs as well as paying for the allocated resources. The default retention period is six days.
On Elastic Cloud Hosted and Elastic Cloud Serverless, AutoOps is set up and enabled automatically in all supported regions, with no action required from you.

For Elastic Cloud Enterprise (ECE), Elastic Cloud on Kubernetes (ECK), and self-managed clusters, you need to connect your cluster to AutoOps. This involves installing Elastic Agent to ship your monitoring metrics to Elastic Cloud through Cloud Connect. Since you can only access AutoOps from the Elastic Cloud UI, you need an Elastic Cloud account for this service.

AutoOps will be available for self-managed air-gapped environments (ECE, ECK, or standard stack deployments) in the future.
Stack Monitoring is a Kibana application that can be enabled on self-managed clusters on your premises, Elastic Cloud Hosted deployments, Elastic Cloud Enterprise (ECE), and Elastic Cloud on Kubernetes (ECK). Stack Monitoring is not available on Elastic Cloud Serverless since Elastic takes care of monitoring and managing your Serverless projects.
Depending on your deployment model, there is some setting up involved to enable Stack Monitoring. You need to configure an agent, specify which logs and metrics you want to collect from all your Elastic Stack components, and where to send them.
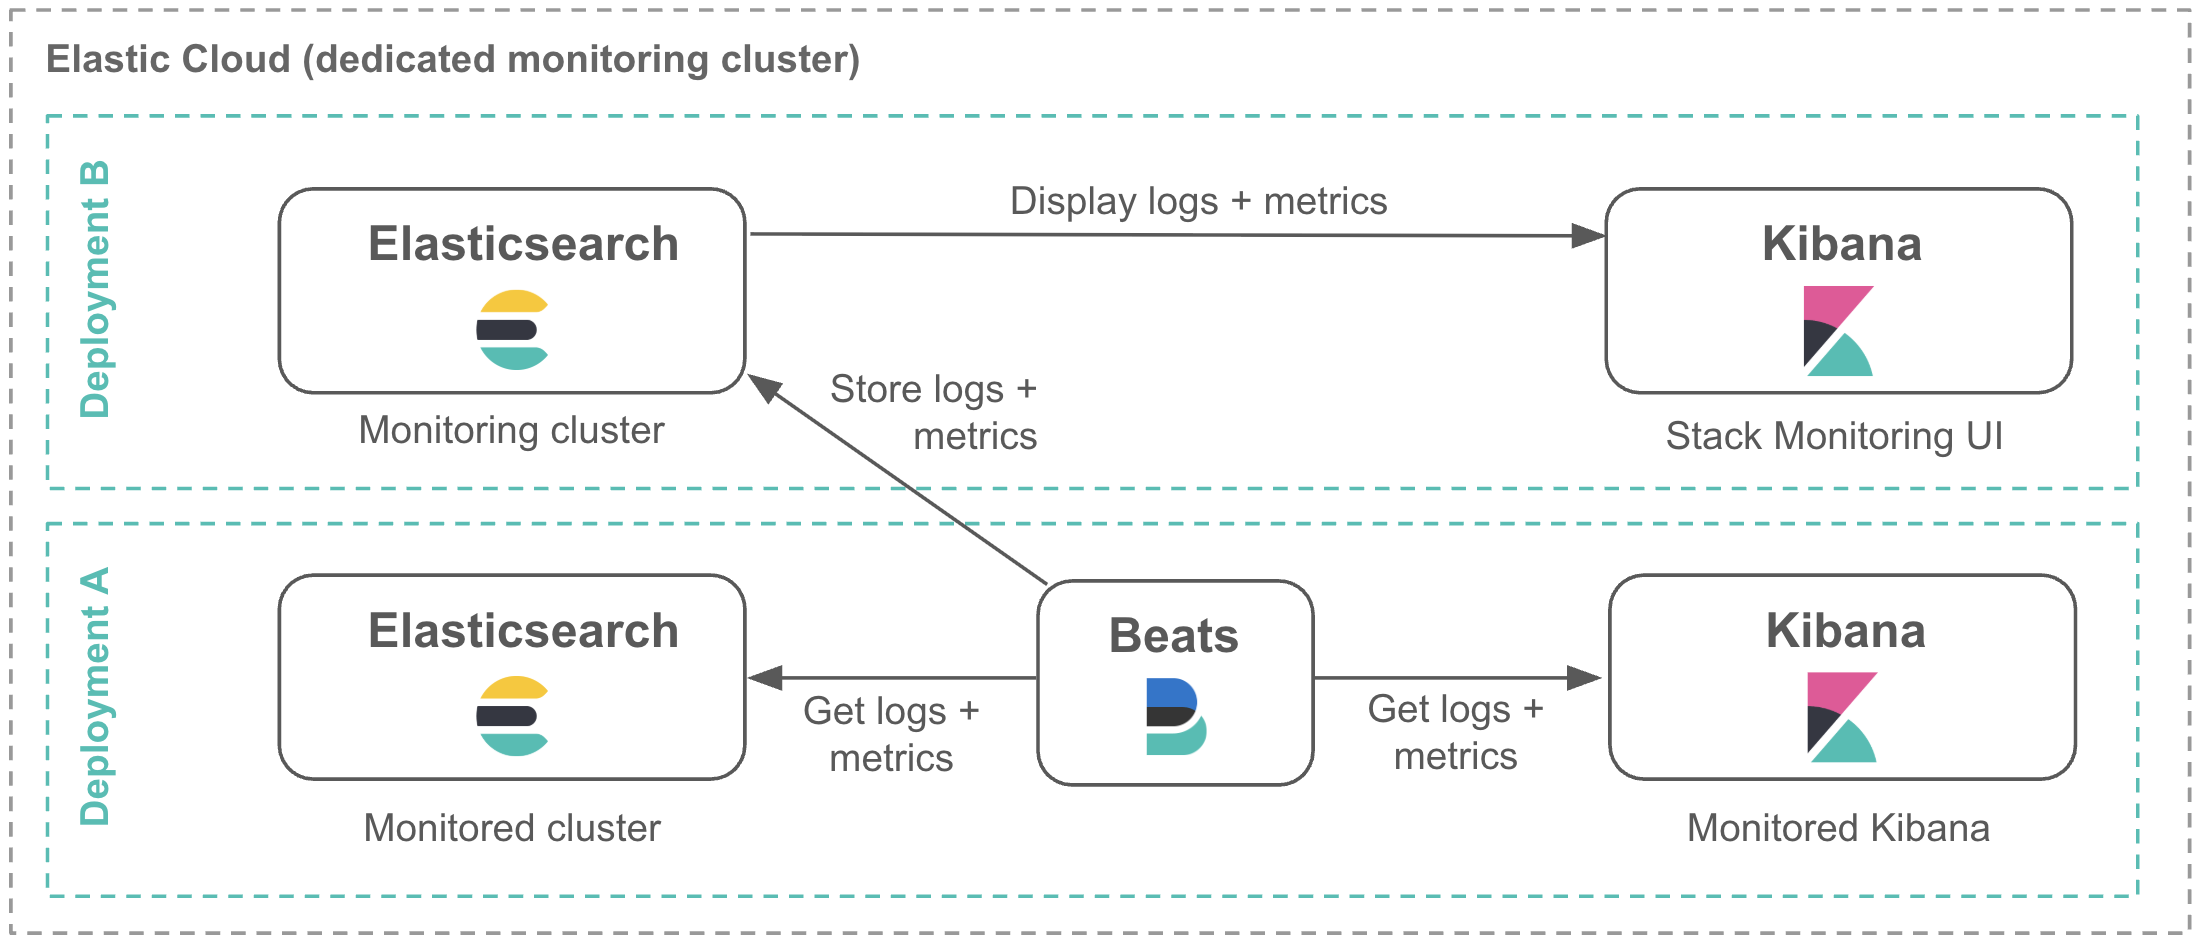
You can store your Stack Monitoring logs and metrics in the following ways:
Within the monitored cluster itself:

Within a dedicated monitoring cluster, if you are concerned about resiliency and availability:

AutoOps lives in Elastic Cloud, so you need to have an Elastic Cloud account to access it. Once logged in, you can access AutoOps from your Elastic Cloud Hosted deployments, Serverless projects, or connect your self-managed clusters to it.
Once setup is complete, you can access the Stack Monitoring UI inside Kibana, where you can monitor all your Elastic Stack components.
The AutoOps agent captures a pre-defined set of Elasticsearch metrics, but doesn’t fetch any logs. AutoOps then performs multi-metrics analysis and correlations to identify issues and potential root causes. When issues are detected, AutoOps raises events and notifies you accordingly. When the issue is resolved, AutoOps automatically closes the event.
For each raised event, AutoOps provides insights into the affected resources (cluster, node, index, shard, etc.), background information on the detected problem, and step-by-step guides to help you diagnose and remediate the identified issues. Most detection rules can be customized by adjusting thresholds, durations, index patterns, data tiers, and more.
The Stack Monitoring UI displays the metrics of your monitored Elastic Stack components over time. Logs can be viewed, searched, and filtered in Discover. You can enable a pre-defined set of alerts that are triggered when specific thresholds are crossed. You can also configure your own alerts on any collected metrics or log messages. However, Stack Monitoring does not offer any further investigation, correlations, or root cause analyses.
The following tables provide a detailed comparison of AutoOps and Stack Monitoring features.
The following features are only available in AutoOps.
| Features | AutoOps | Stack Monitoring | Description |
|---|---|---|---|
| Elasticsearch | |||
| Pre-built customizable alerts | ✅ | ❌ | AutoOps offers hundreds of multi-metric customizable alerts on Elasticsearch specific issues. Stack Monitoring supports some pre-built alerts, but you can build more if needed. |
| Multi metrics analysis | ✅ | ❌ | Advanced detection rules built on multiple metrics. |
| Performance tuning insights | ✅ | ❌ | Insights on tuning configurations and data structures for better Elasticsearch performance. |
| Root cause analysis | ✅ | ❌ | Identification of what went wrong including identifying the affected resources (clusters, nodes, indices, shards). |
| Resolution paths | ✅ | ❌ | Recommendations and suggestions to mitigate detected problems. |
| Knowledge base | ✅ | ❌ | Embedded knowledge base including links to articles and more information. |
| Multi-cluster dashboard | ✅ | ❌ | AutoOps dashboard is better equipped to handle a large number of clusters compared to the Clusters listing page in Stack Monitoring. |
| Events timeline | ✅ | ❌ | Comprehensive timeline of all raised events, organized by severity. |
| Data-tier specific insights | ✅ | ❌ | Visibility into data-tier resource utilization and performance insights per data tier. |
| Node-to-node comparison | ✅ | ❌ | Nodes listing and details combined into the same view for easier node-to-node resource and performance comparison. |
| Index-to-index comparison | ✅ | ❌ | Index listing and details combined into the same view for easier index-to-index resource and performance comparison. |
| Shards load heatmap | ✅ | ❌ | Node/index matrix showing shard activity on different selectable metrics. |
| Template optimizer | ✅ | ❌ | Template/mapping analysis. |
| Slow DSL query analysis | ✅ | ❌ | Identification of reasons for increased latency for DSL queries. |
| Advanced customizations | ✅ | ❌ | Customization and dismissal of detection rules on specific deployments. |
| Notification history | ✅ | ❌ | Comprehensive and curated notification history and reports. |
The following features are common between AutoOps and Stack Monitoring, sometimes with slight variations.
| Features | AutoOps | Stack Monitoring | Description |
|---|---|---|---|
| Elasticsearch | |||
| Clusters listing | ✅ | ✅ | Listing of all monitored clusters. |
| Cluster overview | ✅ | ✅ | Overview of each monitored cluster. |
| ES overview | ✅ | ✅ | Cluster-level performance metrics. |
| ES nodes list | ✅ | ✅ | Listing of all Elasticsearch nodes. |
| ES node details | ✅ | ✅ | Details on a specific node. |
| ES indices list | ✅ | ✅ | Listing of all Elasticsearch indices. AutoOps allows sorting indices by search and indexing latency metrics, but Stack Monitoring doesn’t, making it difficult to identify slow indices. |
| ES index details | ✅ | ✅ | Details on a specific index. |
| Single metric detection | ✅ | ✅ | Basic single-metric detection rules. |
| Simple alert customization | ✅ | ✅ | Basic customization of alerts. |
| Alerts and notifications | ✅ | ✅ | Stack Monitoring provides 27 configurable connectors for alerts and notifications. AutoOps supports 7 of them and the email connector doesn’t require setting up an email server. |
The following features are currently only available in Stack Monitoring. These features will be available in AutoOps over time and any new features will primarily be added to AutoOps.
| Features | AutoOps | Stack Monitoring | Description |
|---|---|---|---|
| Elasticsearch | |||
| Ingest pipeline | ❌ | ✅ | Stack Monitoring supports ingest pipeline monitoring via a link to ad hoc dashboards. These are provided by the Elastic Agent Elasticsearch integration which needs to be installed. |
| CCR | ❌ | ✅ | Insights into CCR metrics. |
| Machine Learning jobs | ❌ | ✅ | Insights into ML job statistics. |
| Raw monitoring data | ❌ | ✅ | Availability of raw monitoring data. |
| Other Stack components | |||
| Basic Kibana monitoring | ❌ | ✅ | More advanced Kibana monitoring is coming soon to AutoOps. |
| Basic Logstash monitoring | ❌ | ✅ | Logstash monitoring in the Stack Monitoring UI has been superseded by the ad hoc dashboards shipped via the Elastic Agent Logstash integration. |
| Basic APM server monitoring | ❌ | ✅ | Standard monitoring of APM servers |
| Basic integration server monitoring | ❌ | ✅ | Standard monitoring of integration servers |
Keep using Stack Monitoring if you:
- are running the Elastic Stack on-premise, air-gapped or otherwise
- need to control monitoring data retention
- need monitoring coverage for Elastic Stack components other than Elasticsearch
- have deployments in a region where AutoOps is not available yet
Start using AutoOps if you want:
- easier monitoring of your Elastic Cloud deployments
- clear guidance and troubleshooting advice when issues arise
- to efficiently monitor a large number of deployments
- a comprehensive picture of the historical health of your deployments
- your events and alerts to be highly customizable
- an advanced notification system tailored for specific clusters and alert conditions
- simplified interactions with Elastic Support