Docker OpenTelemetry Assets
Serverless Observability Serverless Security Stack
| Version | 0.2.0 (View all) |
| Subscription level What's this? |
Basic |
| Developed by What's this? |
Elastic |
To use beta integrations, go to the Integrations page in Kibana, scroll down, and toggle on the Display beta integrations option.
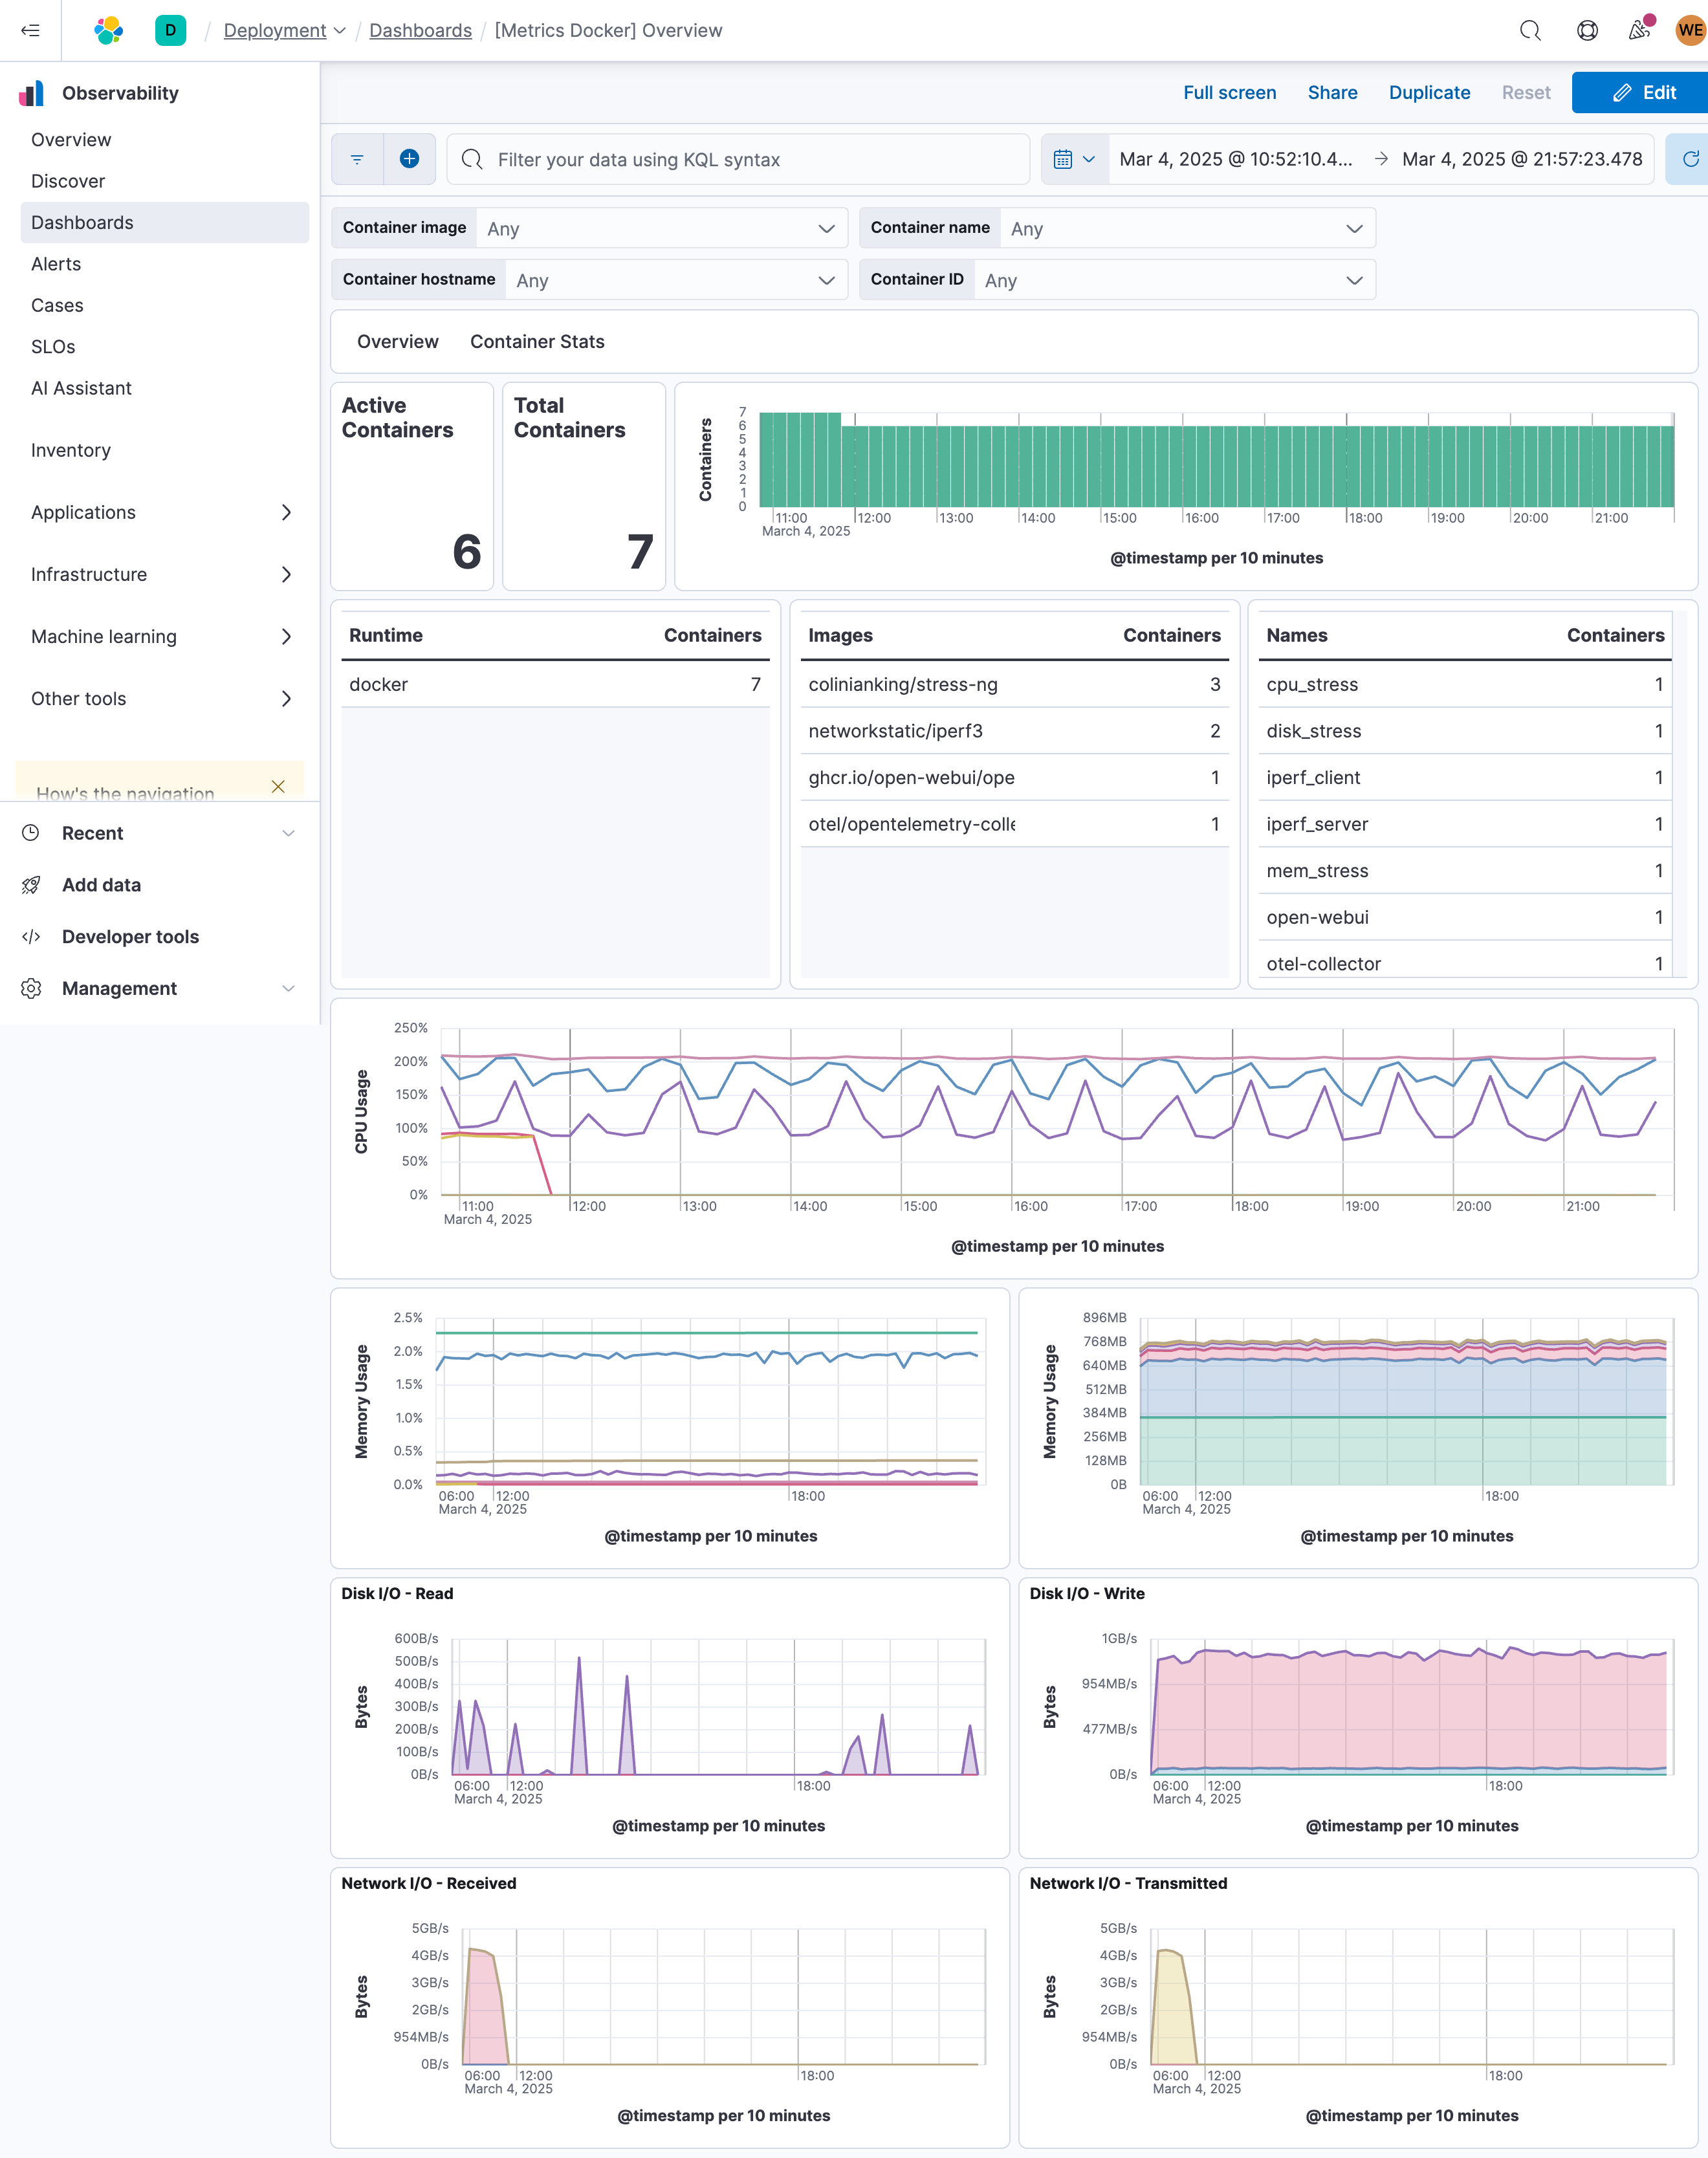
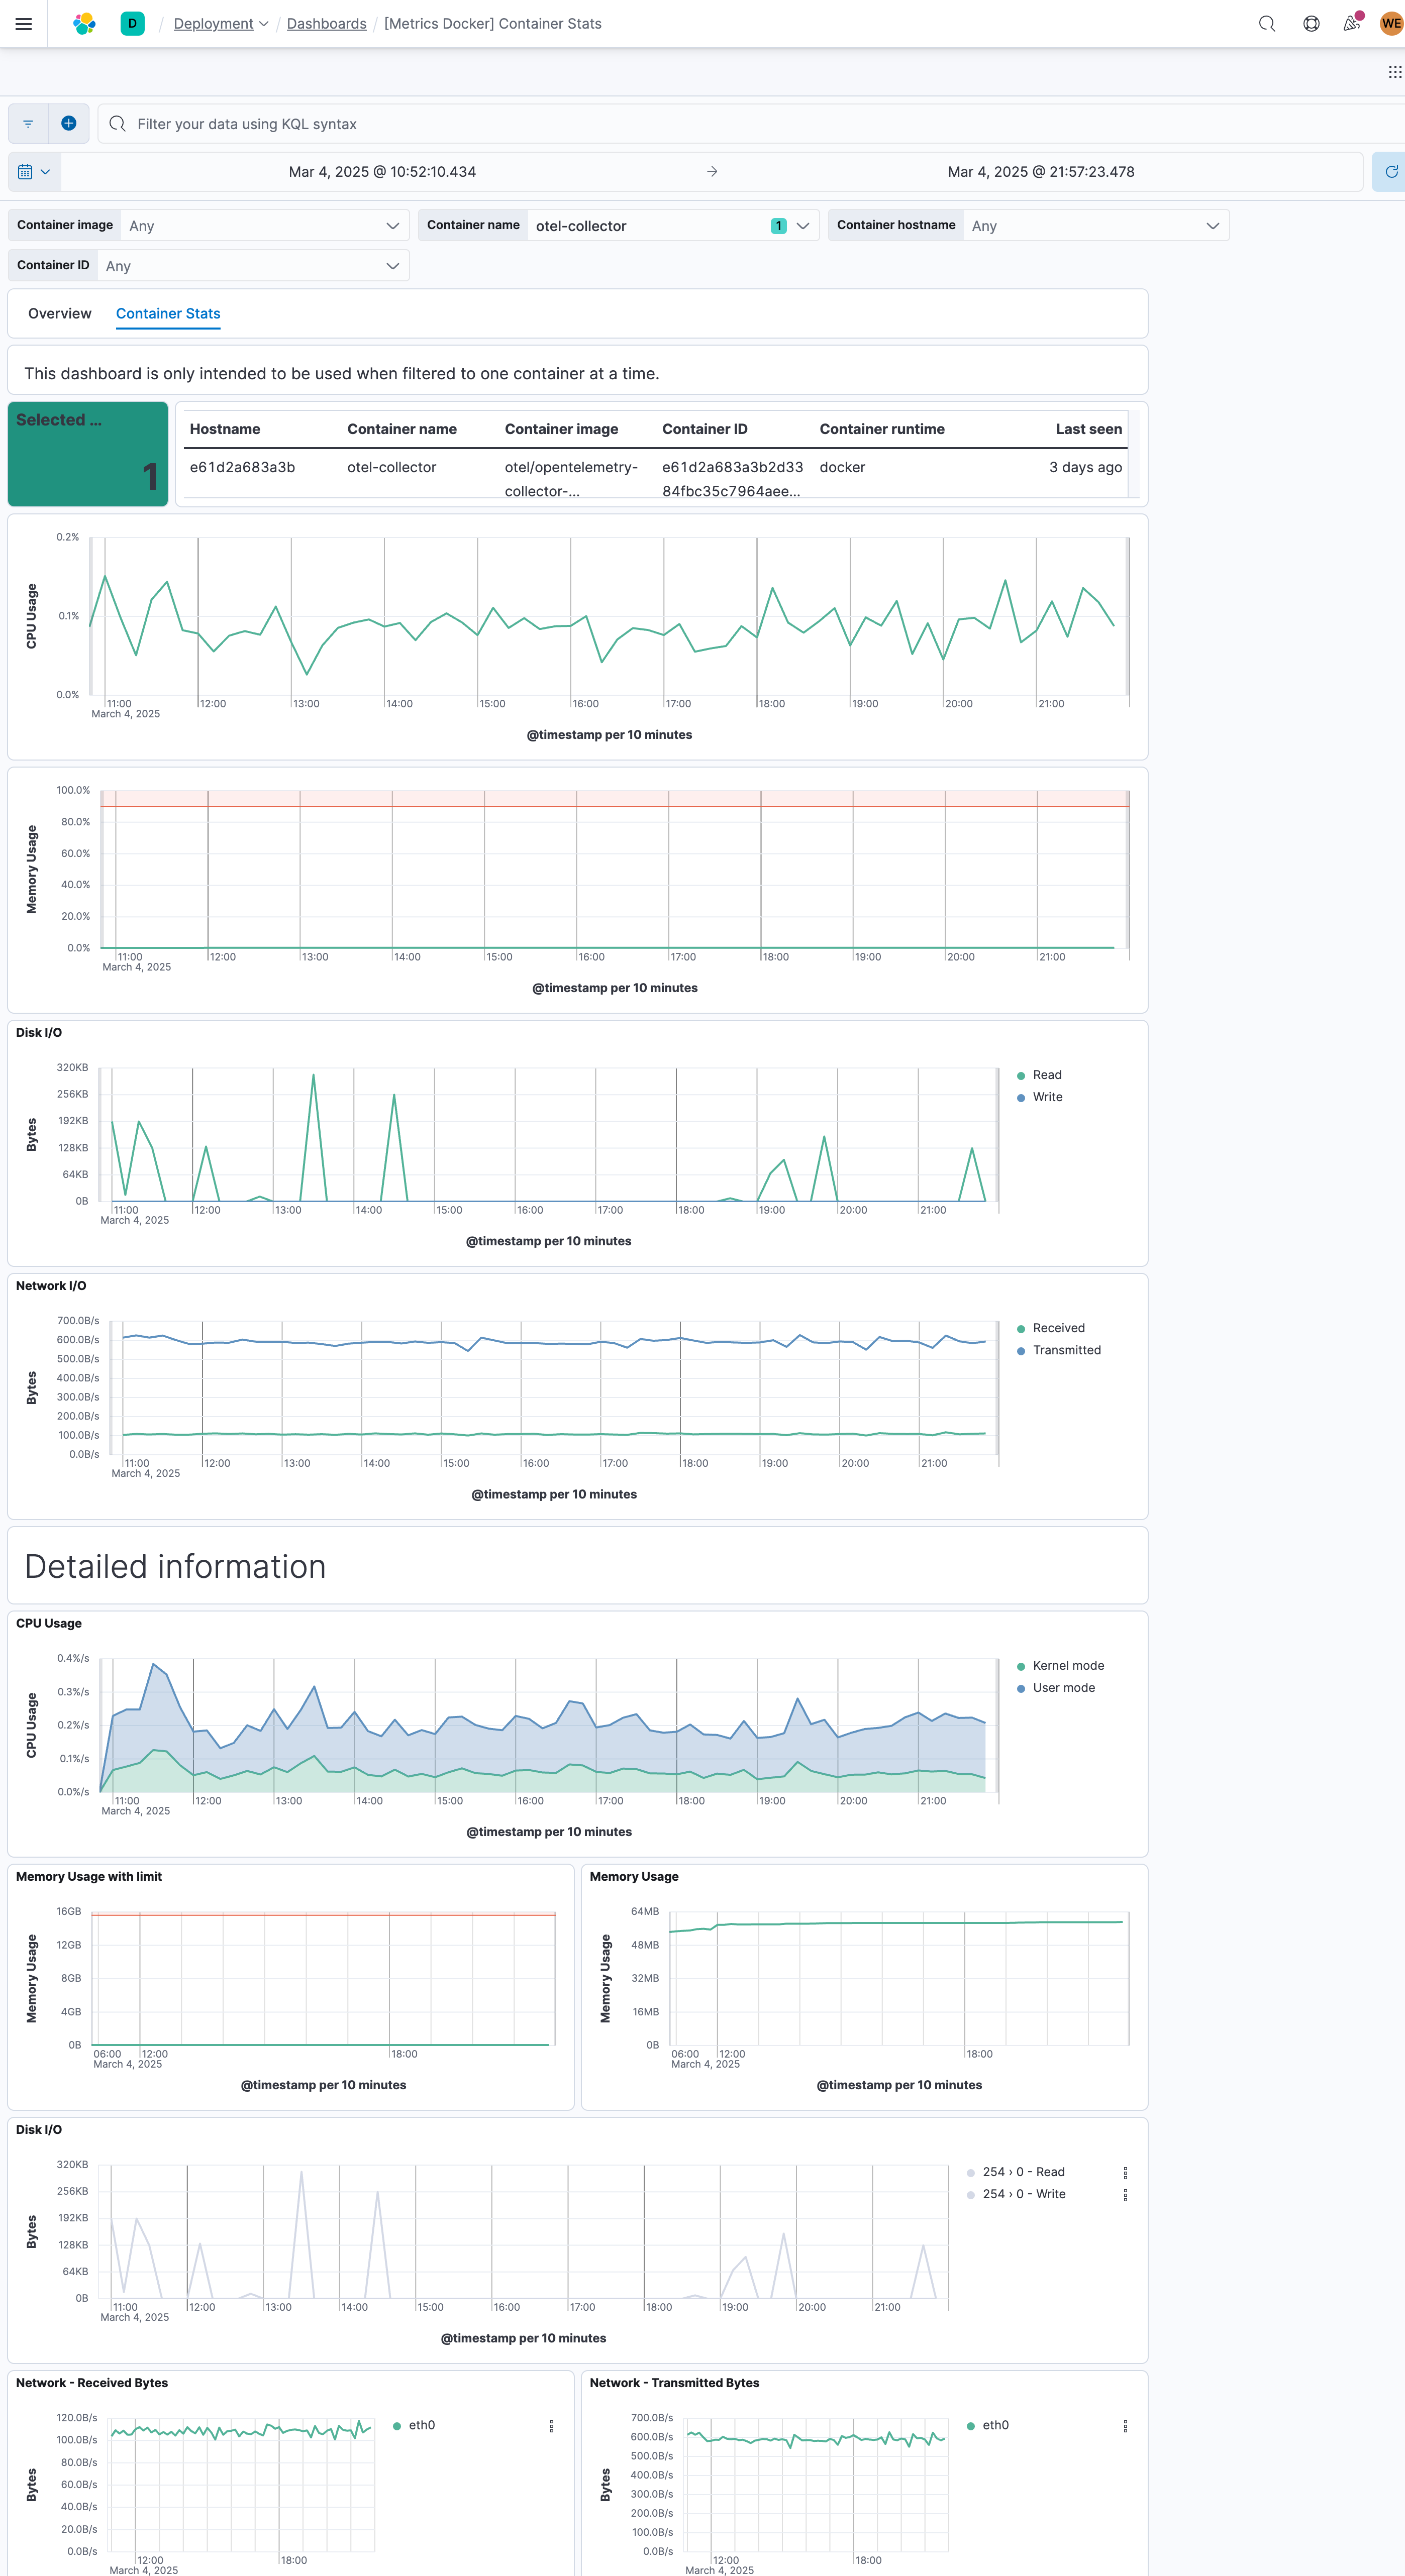
The Docker OpenTelemetry Assets content package provides out-of-the-box dashboards for visualizing container performance and resource utilization metrics such as CPU usage, memory consumption, disk I/O, and network traffic from Docker hosts running OpenTelemetry Collector with the Docker Stats Receiver.
For example, if you wanted to monitor container CPU spikes, you could track CPU usage metrics across all containers. Then you can visualize these metrics in dashboards or create alerts when CPU usage exceeds defined thresholds.
The minimal required configuration for the Docker Stats Receiver is:
receivers:
  docker_stats:
Additional configuration options are available in the OpenTelemetry Docker Stats Receiver documentation. The configuration options available will depend on the version of the OpenTelemetry Collector you are using.
This integration includes one or more Kibana dashboards that visualizes the data collected by the integration. The screenshots below illustrate how the ingested data is displayed.
Changelog
| Version | Details | Kibana version(s) |
|---|---|---|
| 0.2.0 | Enhancement (View pull request) Add discovery field to support auto-install |
— |
| 0.1.2 | Enhancement (View pull request) Add opentelemetry category |
— |
| 0.1.1 | Bug fix (View pull request) Update documentation and fix Data View ID |
— |
| 0.1.0 | Enhancement (View pull request) Initial availability of the package |
— |

